Georgetown: Fire Incidents, Delaware (DE)
Where are fire incidents reported in Georgetown, DE
Something went wrong! Please refresh the page.
|
| |||||||||||||||||||||||||||||||||||||||||||||||||||||||||||||||||||||||||||||||||||||||||||||||||||||||||||||
| Other | 665 | |||||||||||||||||||||||||||||||||||||||||||||||||||||||||||||||||||||||||||||||||||||||||||||||||||||||||||||
2002 - 2018 National Fire Incident Reporting System (NFIRS) incidents
- Incident types reported to NFIRS in Georgetown, DE
- 1,28529.2%Fire
- 1,14526.0%Rescue & EMS
- 68715.6%Hazardous Condition
- 55012.5%False Alarm
- 3588.1%Good Intent Call
- 3437.8%Service Call
- 250.6%Severe Weather
- 60.1%Overpressure Rupture
- Fire incident types reported to NFIRS in Georgetown, DE
- 53141.3%Structure Fires
- 45535.4%Outside Fires
- 18514.4%Mobile Property/Vehicle Fires
- 1148.9%Other
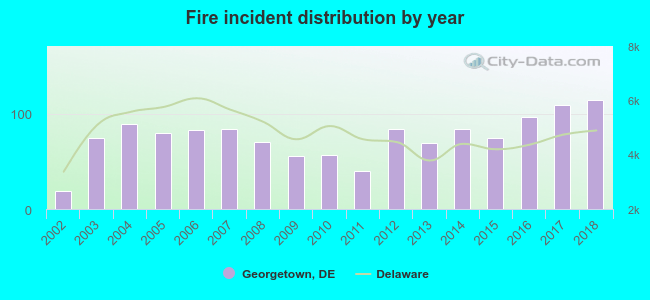 According to the data from the years 2002 - 2018 the average number of fire incidents per year is 76. The highest number of fire incidents - 114 took place in 2018, and the least - 19 in 2002. The data has a growing trend.
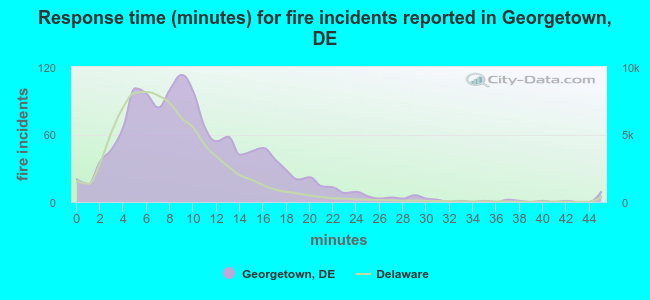 The median response time based on all reported fire incidents is 9 minutes. This is higher than the state median value.
The median response time in Georgetown, DE compared to nearest cities:
(Note: Based on data for all years, including only cities with at least 500 fire incidents)
| Georgetown: | 9 minutes |
| Millsboro: | 9 minutes |
| Bridgeville: | 9 minutes |
| Dagsboro: | 9 minutes |
| Seaford: | 7 minutes |
| Greenwood: | 10 minutes |
| Laurel: | 10 minutes |
| Frankford: | 8 minutes |
| Lewes: | 8 minutes |
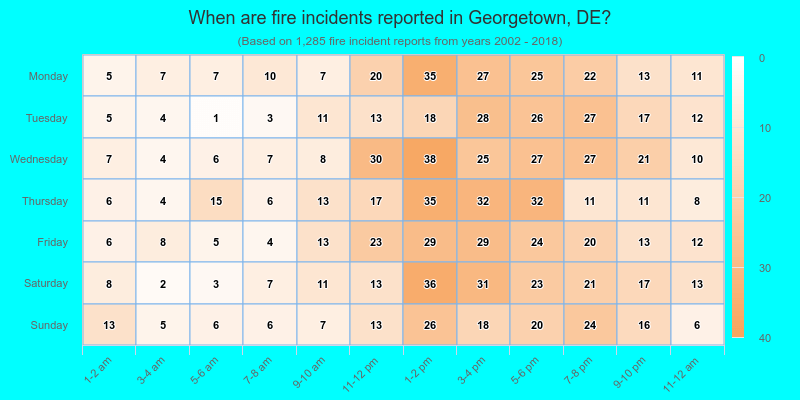
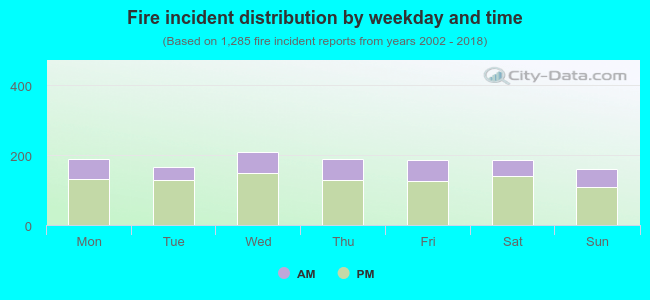 28.7% incidents where reported in the morning and 71.3% in the evening. The most fires (16.3%) took place on Wednesday, and the least (12.5%) on Sunday.
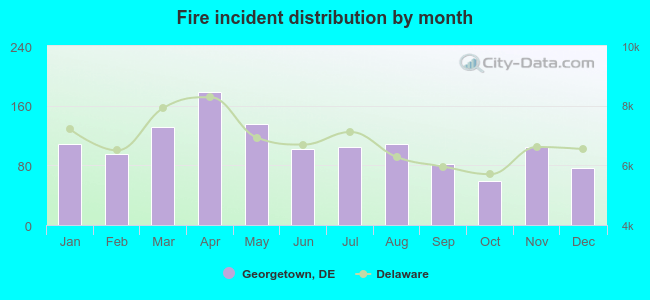 Based on the 1,285 fire incidents from years 2002 - 2018 most fires (13.9%) took place during April, and the least (4.6%) in October.
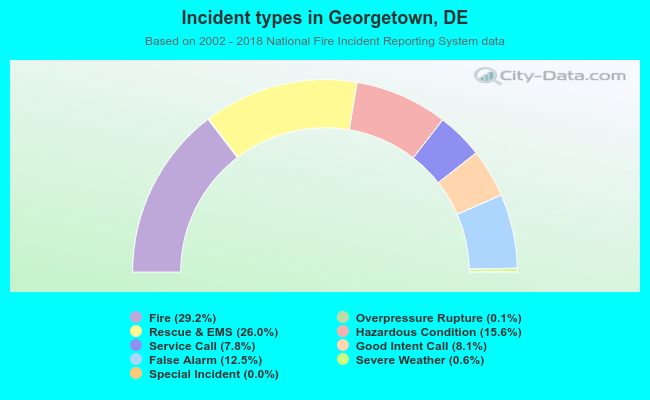 Out of all 4,400 cases reported during the years 2002 - 2018, the most belonged to the categories: Fire (29.2%), Rescue & EMS (26.0%), and Hazardous Condition (15.6%).
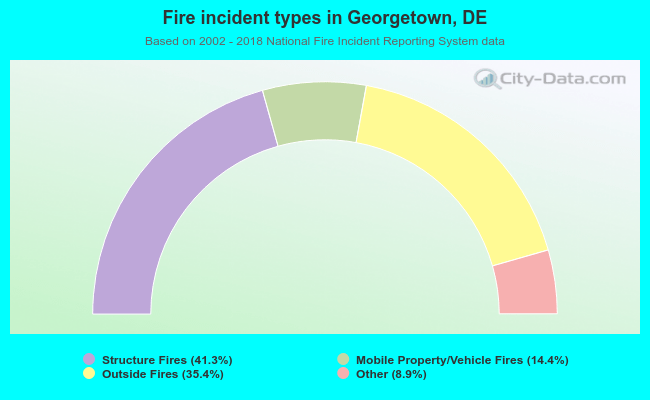 When looking into fire subcategories, the most reports belonged to: Structure Fires (41.3%), and Outside Fires (35.4%).