Gibbon: Fire Incidents, Nebraska (NE)
Where are fire incidents reported in Gibbon, NE
Something went wrong! Please refresh the page.
|
| |||||||||||||||||||||||||||||||||||||||||||||||||||||||||||||||||||||||||||||||||||||||||||||||||||||||||||||
2002 - 2017 National Fire Incident Reporting System (NFIRS) incidents
- Incident types reported to NFIRS in Gibbon, NE
- 15478.6%Fire
- 2613.3%Hazardous Condition
- 73.6%Good Intent Call
- 42.0%Rescue & EMS
- 21.0%False Alarm
- 10.5%Service Call
- 10.5%Severe Weather
- 10.5%Special Incident
- Fire incident types reported to NFIRS in Gibbon, NE
- 9159.1%Outside Fires
- 3321.4%Structure Fires
- 2616.9%Mobile Property/Vehicle Fires
- 42.6%Other
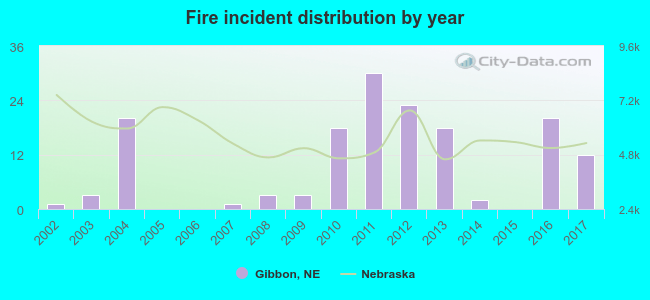 According to the data from the years 2002 - 2017 the average number of fires per year is 10. The highest number of reported fires - 30 took place in 2011, and the least - 0 in 2005. The data has a rising trend.
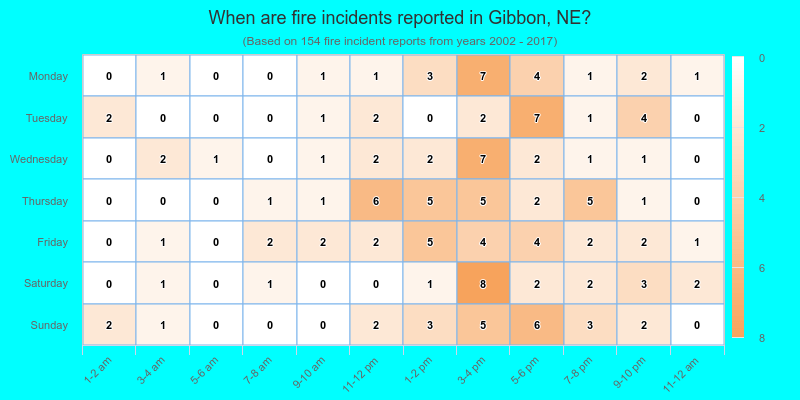
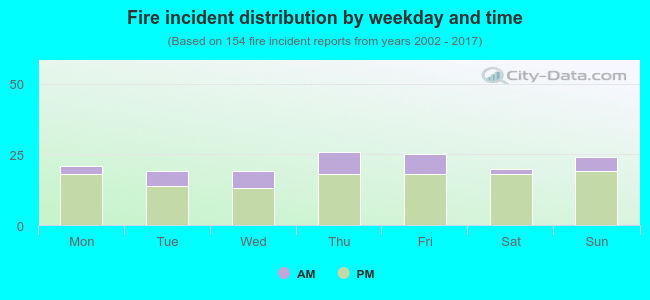 23.4% incidents where reported in the morning and 76.6% in the evening. The most fires (16.9%) took place on Thursday, and the least (12.3%) on Tuesday.
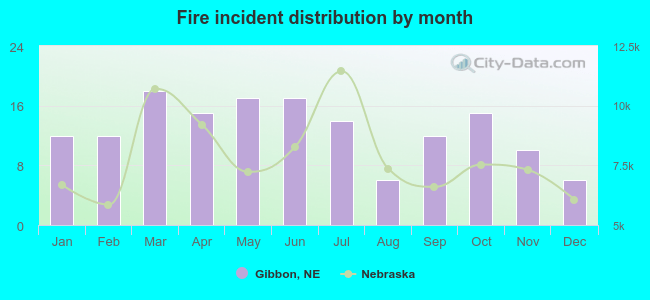 Based on the 154 reports from years 2002 - 2017 most fires (11.7%) took place during March, and the least (3.9%) in August.
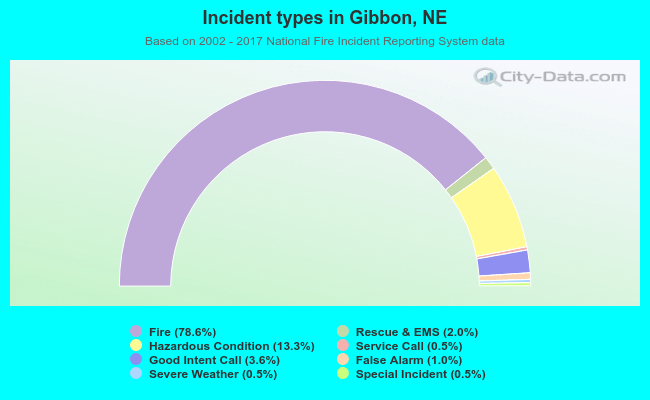 Out of all 196 cases reported during the years 2002 - 2017, the most belonged to the categories: Fire (78.6%), Rescue & EMS (13.3%), and Service Call (3.6%).
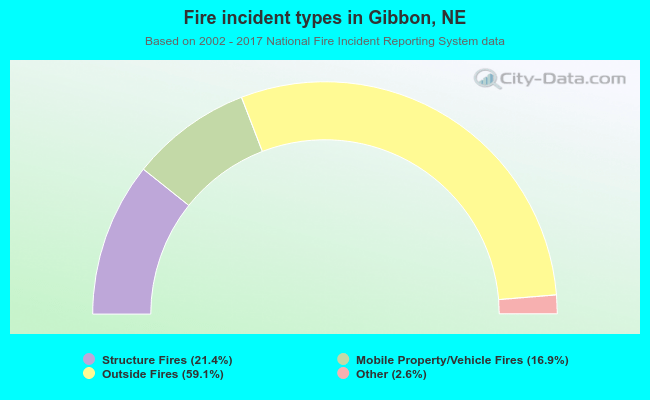 When looking into fire subcategories, the most incidents belonged to: Outside Fires (59.1%), and Structure Fires (21.4%).