Giddings: Fire Incidents, Texas (TX)
Where are fire incidents reported in Giddings, TX
Something went wrong! Please refresh the page.
|
| |||||||||||||||||||||||||||||||||||||||||||||||||||||||||||||||||||||||||||||||||||||||||||||||||||||||||||||
| Other | 30 | |||||||||||||||||||||||||||||||||||||||||||||||||||||||||||||||||||||||||||||||||||||||||||||||||||||||||||||
2003 - 2018 National Fire Incident Reporting System (NFIRS) incidents
- Incident types reported to NFIRS in Giddings, TX
- 92453.0%Fire
- 41123.6%Hazardous Condition
- 22012.6%Good Intent Call
- 925.3%Rescue & EMS
- 724.1%False Alarm
- 221.3%Service Call
- 30.2%Severe Weather
- Fire incident types reported to NFIRS in Giddings, TX
- 58062.8%Outside Fires
- 18720.2%Structure Fires
- 12013.0%Mobile Property/Vehicle Fires
- 374.0%Other
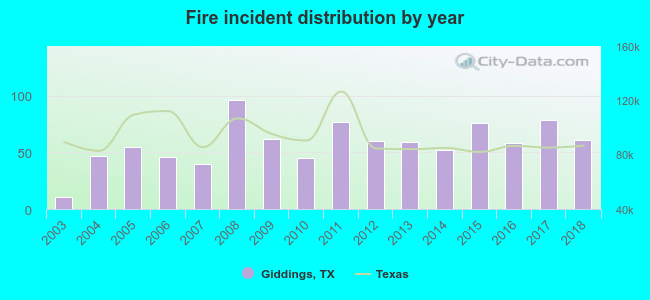 Based on the data from the years 2003 - 2018 the average number of fires per year is 58. The highest number of fire incidents - 96 took place in 2008, and the least - 11 in 2003. The data has a growing trend.
The average number of yearly fire incidents per 10k residents in Giddings, TX compared to nearest cities:
(Note: Based on data for the last 3 years, including only cities with population 5,000 and above)
| Giddings: | 130.9 |
| Bastrop: | 180.3 |
| Elgin: | 13.1 |
| Brenham: | 36.6 |
| Rockdale: | 49.8 |
| Manor: | 38.5 |
| Taylor: | 46.1 |
| Hutto: | 42.8 |
| Pflugerville: | 20.1 |
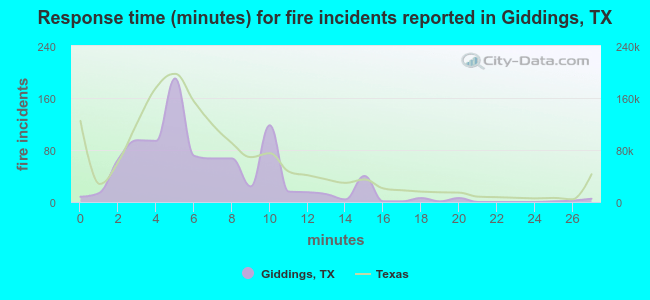 The median response time based on all reported fire incidents is 5 minutes. This is lower compared to the Texas median value.
The median response time in Giddings, TX compared to nearest cities:
(Note: Based on data for all years, including only cities with at least 500 fire incidents)
| Giddings: | 5 minutes |
| Smithville: | 10 minutes |
| La Grange: | 10 minutes |
| Bastrop: | 7 minutes |
| Caldwell: | 12 minutes |
| Brenham: | 5 minutes |
| Rockdale: | 9 minutes |
| Schulenburg: | 7 minutes |
| Flatonia: | 0 minutes |
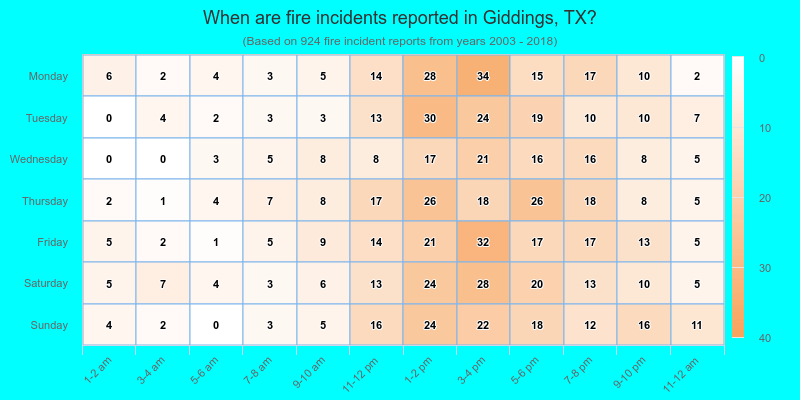
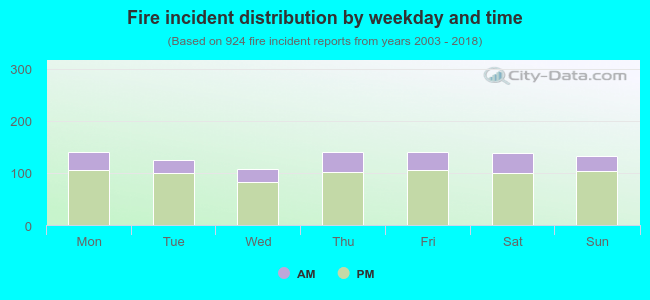 24.5% incidents where reported in the morning and 75.5% in the evening. The most fires (15.3%) took place on Friday, and the least (11.6%) on Wednesday.
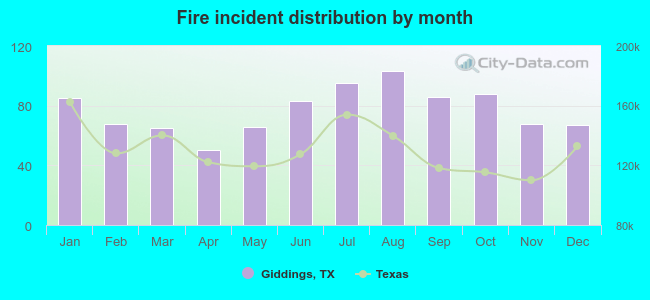 According to the 924 fire incidents from years 2003 - 2018 most fires (11.1%) took place during August, and the least (5.4%) in April.
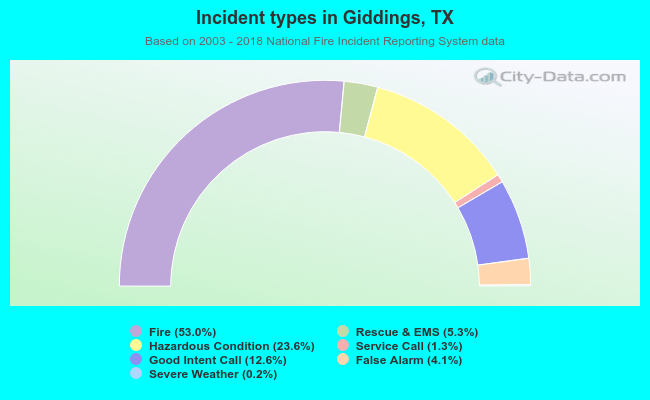 Out of all 1,744 cases reported during the years 2003 - 2018, the most belonged to the categories: Fire (53.0%), Rescue & EMS (23.6%), and Service Call (12.6%).
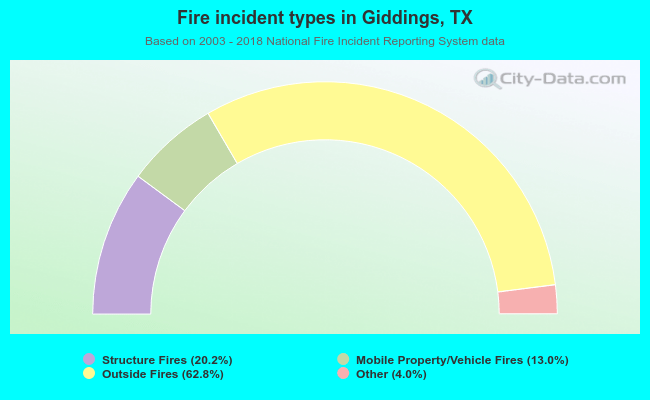 When looking into fire subcategories, the most incidents belonged to: Outside Fires (62.8%), and Structure Fires (20.2%).