| Fire incidents reported |
|---|
| Sreet name | Count |
|---|
| PROVINCE RD | 48 | | NH ROUTE 140 | 46 | | ALLENS MILL RD | 22 | | HATTIE SMITH RD | 20 | | NH ROUTE 106 | 20 | | STOCKWELL HILL RD | 20 | | STAGE RD | 18 | | UPPER CITY RD | 18 | | LOON POND RD | 16 | | MIDDLE RT | 16 | | ROUTE 140 | 14 | | SAWTOOTH RD | 14 | | ALLENS MILLGILMANTON RD | 12 | | BURKE RD | 12 | | LAKESHORE DR | 12 | | MIDDLE ROUTE | 12 | | HATCH RD | 10 | | MEETING HOUSE RD | 10 | | NH ROUTE 129 | 10 | | WHITE OAK RD | 10 | | HEMLOCK DR | 8 | | NH ROUTE 107 RT | 8 | | RT 106 | 8 | | RT 140 | 8 | | WOOD DR | 8 |
| | | Fire incidents reported |
|---|
| Sreet name | Count |
|---|
| GALE RD | 6 | | LAKESHOREGILMANTON DR | 6 | | NH ROUTE 106GILMANTON | 6 | | NH ROUTE 140 RT | 6 | | NH RT 140 | 6 | | RTE 140 | 6 | | STOCKWELL HILLGILMANTON RD | 6 | | BUNKER LN | 4 | | CHURCH ST | 4 | | ELM ST | 4 | | GALE RD | 4 | | GALE ROAD | 4 | | GRANT HILL RD | 4 | | GRIFFIN RD | 4 | | HATTIE SMITH ROAD | 4 | | HATTIE SMITHGILMANTON RD | 4 | | LAKE SHORE DR | 4 | | LEATHER STOCKING LN | 4 | | LOU LN | 4 | | MEADOW POND RD | 4 | | MIDDLE RTE | 4 | | MOCASSIN PATH | 4 | | MOUNTAIN ROAD | 4 | | NH ROUTE 140GILMANTON | 4 | | |
|
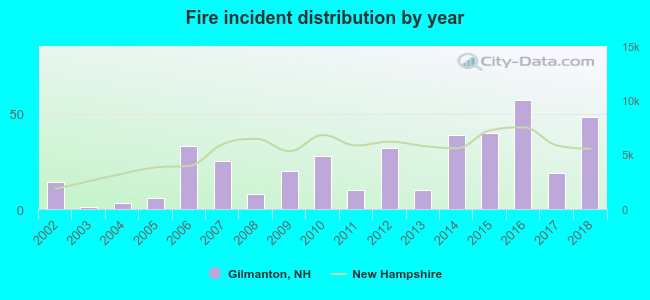 Based on the data from the years 2002 - 2018 the average number of fires per year is 23. The highest number of reported fire incidents - 57 took place in 2016, and the least - 1 in 2003. The data has a growing trend.
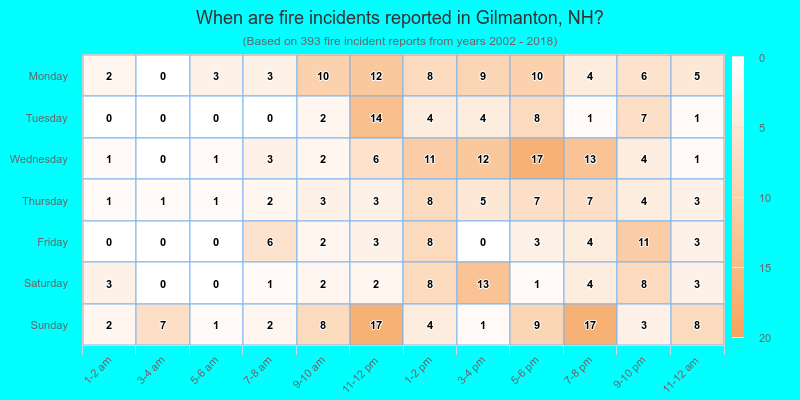
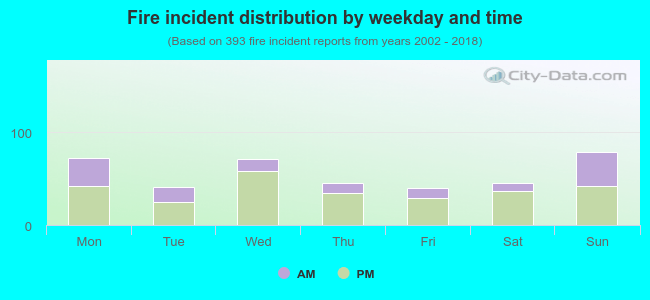 32.1% incidents where reported in the morning and 67.9% in the evening. The most fires (20.1%) took place on Sunday, and the least (10.2%) on Friday.
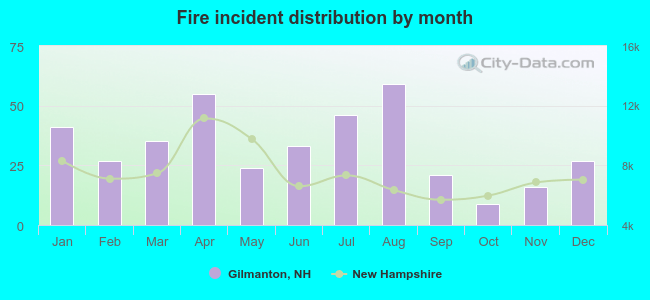 Based on the 393 reports from years 2002 - 2018 most fires (15.0%) took place during August, and the least (2.3%) in October.
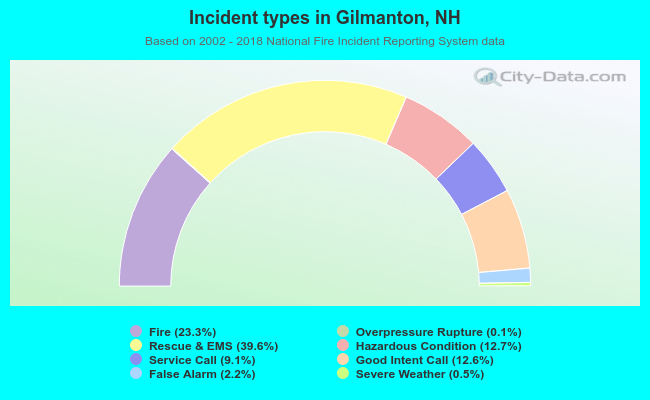 Out of all 1,689 cases reported during the years 2002 - 2018, the most belonged to the categories: Rescue & EMS (39.6%), Fire (23.3%), and Hazardous Condition (12.7%).
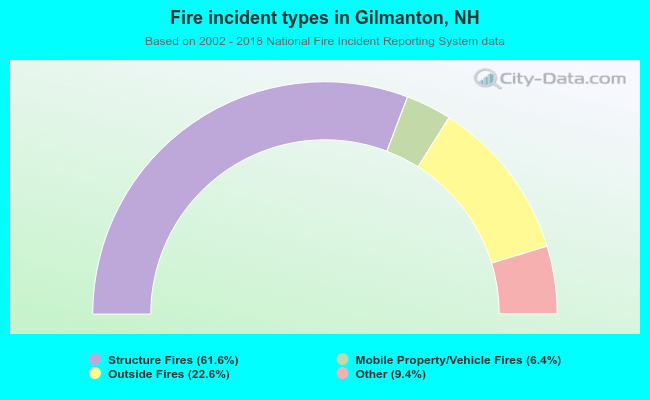 When looking into fire subcategories, the most incidents belonged to: Structure Fires (61.6%), and Outside Fires (22.6%).