Glasgow: Fire Incidents, Kentucky (KY)
Where are fire incidents reported in Glasgow, KY
Something went wrong! Please refresh the page.
| Fire incidents reported | |
|---|---|
| Sreet name | Count |
| MAIN ST | 98 |
| HAPPY VALLEY RD | 86 |
| CLEVELAND AVE | 66 |
| CUMBERLAND PKY | 64 |
| TOMPKINSVILLE RD | 64 |
| L R WELLS BLVD | 56 |
| ROSEVILLE RD | 50 |
| FINNEY RD | 48 |
| FINNEY RD | 44 |
| CORAL HILL RD | 38 |
| COLUMBIA AVE | 34 |
| GLEN GARRY RD | 34 |
| NEW BOWLING GREEN RD | 34 |
| ROSEVILLE RD | 34 |
| BURKESVILLE RD | 32 |
| OLD BOWLING GREEN RD | 32 |
| SCOTTSVILLE RD | 28 |
| FRANKLIN ST | 26 |
| FRONT ST | 26 |
| LICK BRANCH RD | 24 |
| MCKENNA ST | 24 |
| MORGAN ST | 24 |
| PARK CITY GLASGOW RD | 24 |
| RACE | 24 |
| BRYAN ST | 22 |
| GREEN ST | 22 |
| OIL WELL RD | 22 |
| BECKTON ROCKY HILL RD | 20 |
| HOLLOW RD | 20 |
| POPLAR SPRING RD | 20 |
| Other | 965 |
2003 - 2018 National Fire Incident Reporting System (NFIRS) incidents
- Incident types reported to NFIRS in Glasgow, KY
- 3,91738.3%Rescue & EMS
- 2,10520.6%Fire
- 1,45314.2%Service Call
- 1,20911.8%Good Intent Call
- 7977.8%False Alarm
- 6796.6%Hazardous Condition
- 250.2%Overpressure Rupture
- 230.2%Severe Weather
- 230.2%Special Incident
- Fire incident types reported to NFIRS in Glasgow, KY
- 89142.3%Outside Fires
- 67932.3%Structure Fires
- 39718.9%Mobile Property/Vehicle Fires
- 1386.6%Other
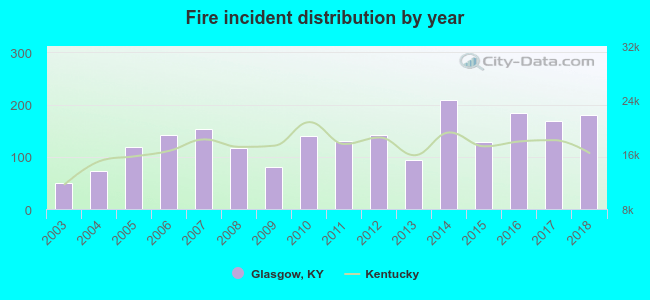 Based on the data from the years 2003 - 2018 the average number of fire incidents per year is 132. The highest number of reported fire incidents - 208 took place in 2014, and the least - 50 in 2003. The data has a rising trend.
The average number of yearly fire incidents per 10k residents in Glasgow, KY compared to nearest cities:
(Note: Based on data for the last 3 years, including only cities with population 5,000 and above)
| Glasgow: | 123.7 |
| Bowling Green: | 60.7 |
| Leitchfield: | 84.4 |
| Campbellsville: | 62.0 |
| Franklin: | 56.0 |
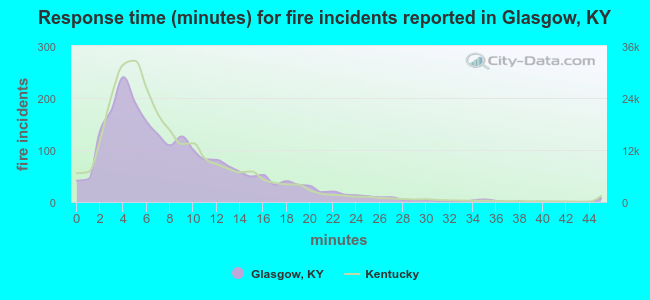 The median response time based on all reported fire incidents is 7 minutes. This is close to the Kentucky median value.
The median response time in Glasgow, KY compared to nearest cities:
(Note: Based on data for all years, including only cities with at least 500 fire incidents)
| Glasgow: | 7 minutes |
| Smiths Grove: | 12 minutes |
| Scottsville: | 10 minutes |
| Tompkinsville: | 11 minutes |
| Bowling Green: | 6 minutes |
| Greensburg: | 10 minutes |
| Burkesville: | 13 minutes |
| Columbia: | 12 minutes |
| Leitchfield: | 4 minutes |
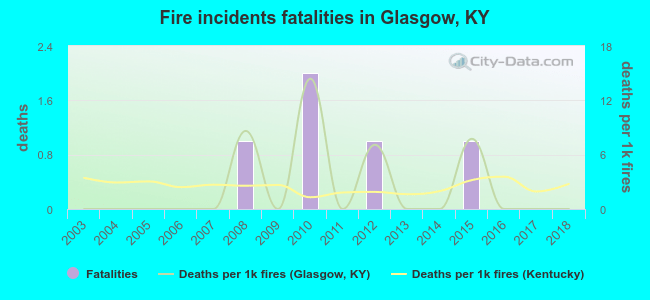 Based on the data from the years 2003 - 2018 the average number of fire-related yearly deaths is 0. The highest number of deaths - 2 took place in 2010, and the lowest - 0 in 2003. The data has a constant trend.
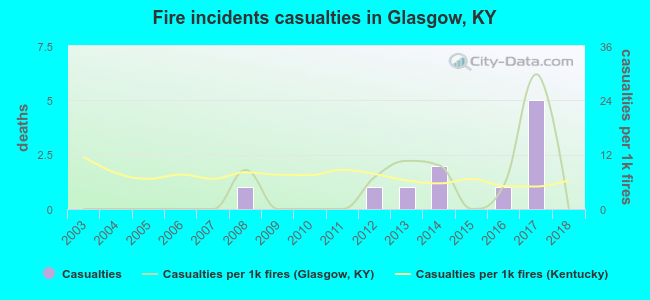 According to the data from the years 2003 - 2018 the average number of fire-related yearly casualties is 1. The highest number of casualties - 5 took place in 2017, and the lowest - 0 in 2003. The data has a constant trend.
The average number of casualties per 1,000 fires is 4. This indicator was the highest - 30 in 2017, and the lowest 0 in 2003. The trend for casualties per 1,000 incidents is constant. Compared to the Kentucky value the number of casualties per 1,000 fires is lower.
According to the data from the years 2003 - 2018 the average number of fire-related yearly casualties is 1. The highest number of casualties - 5 took place in 2017, and the lowest - 0 in 2003. The data has a constant trend.
The average number of casualties per 1,000 fires is 4. This indicator was the highest - 30 in 2017, and the lowest 0 in 2003. The trend for casualties per 1,000 incidents is constant. Compared to the Kentucky value the number of casualties per 1,000 fires is lower.Casualties per 1,000 incidents in Glasgow, KY compared to nearest cities:
(Note: Based on data for all years, including only cities with at least 500 fire incidents)
| Glasgow: | 5.2 |
| Smiths Grove: | 0.0 |
| Scottsville: | 1.9 |
| Tompkinsville: | 0.0 |
| Bowling Green: | 4.0 |
| Greensburg: | 0.0 |
| Burkesville: | 0.0 |
| Columbia: | 0.0 |
| Leitchfield: | 0.0 |
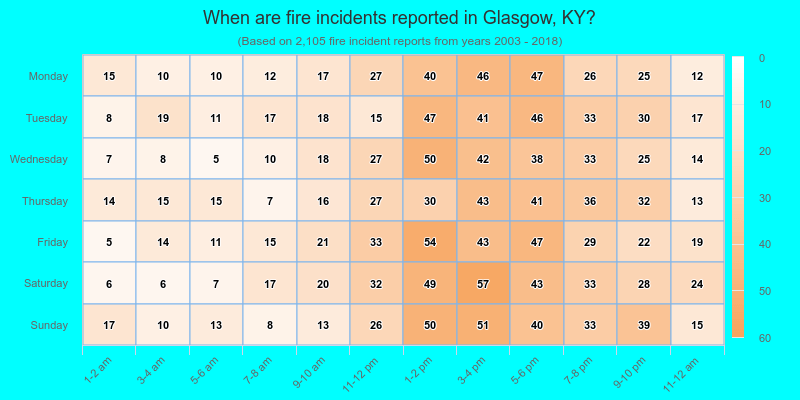
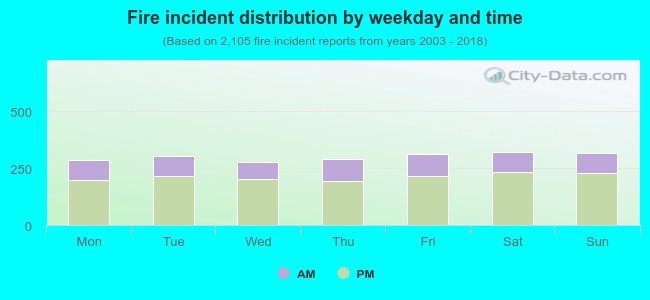 29.5% incidents where reported in the morning and 70.5% in the evening. The most fires (15.3%) took place on Saturday, and the least (13.2%) on Wednesday.
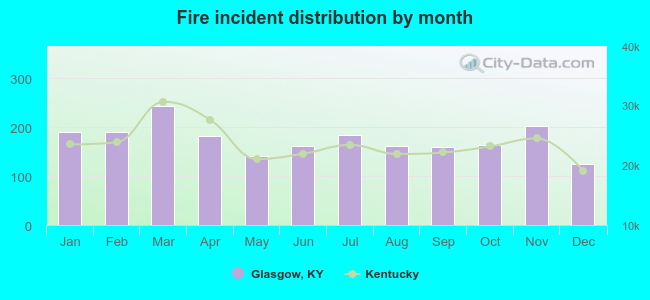 Based on the 2,105 fire incidents from years 2003 - 2018 most fires (11.6%) took place during March, and the least (5.9%) in December.
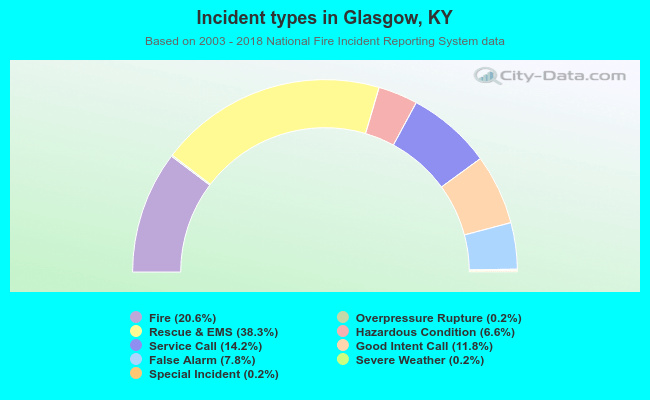 Out of all 10,231 cases reported during the years 2003 - 2018, the most belonged to the categories: Rescue & EMS (38.3%), Fire (20.6%), and Service Call (14.2%).
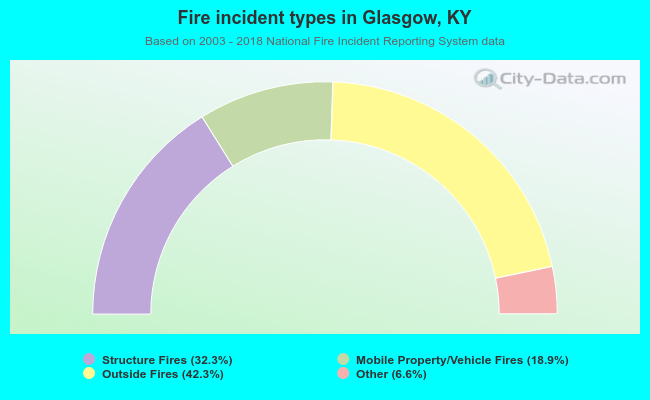 When looking into fire subcategories, the most incidents belonged to: Outside Fires (42.3%), and Structure Fires (32.3%).