Goldthwaite: Fire Incidents, Texas (TX)
Where are fire incidents reported in Goldthwaite, TX
Something went wrong! Please refresh the page.
|
| |||||||||||||||||||||||||||||||||||||||||||||||||||||||||||||||||||||||||||||||||||||||||||||||||||||||||||||
| Other | 79 | |||||||||||||||||||||||||||||||||||||||||||||||||||||||||||||||||||||||||||||||||||||||||||||||||||||||||||||
2004 - 2018 National Fire Incident Reporting System (NFIRS) incidents
- Incident types reported to NFIRS in Goldthwaite, TX
- 36773.8%Fire
- 8416.9%Rescue & EMS
- 285.6%Service Call
- 122.4%Hazardous Condition
- 51.0%Good Intent Call
- 10.2%False Alarm
- Fire incident types reported to NFIRS in Goldthwaite, TX
- 28677.9%Outside Fires
- 4512.3%Structure Fires
- 195.2%Mobile Property/Vehicle Fires
- 174.6%Other
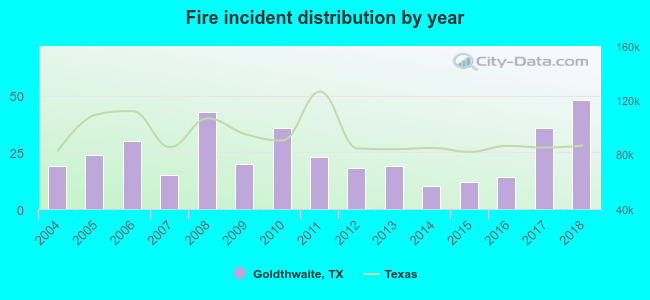 According to the data from the years 2004 - 2018 the average number of fires per year is 24. The highest number of reported fires - 48 took place in 2018, and the least - 10 in 2014. The data has a rising trend.
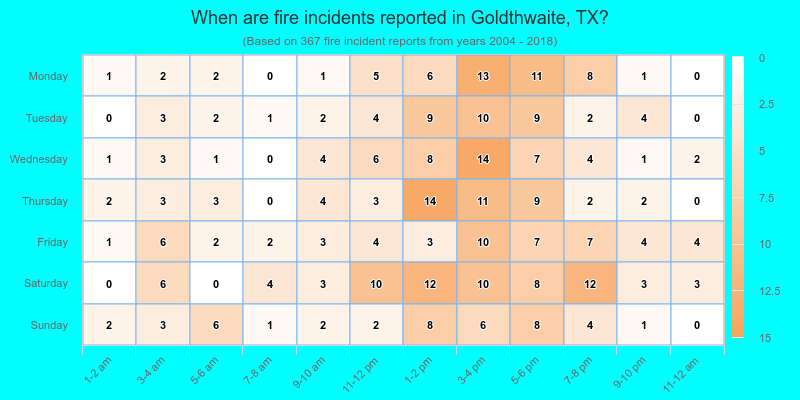
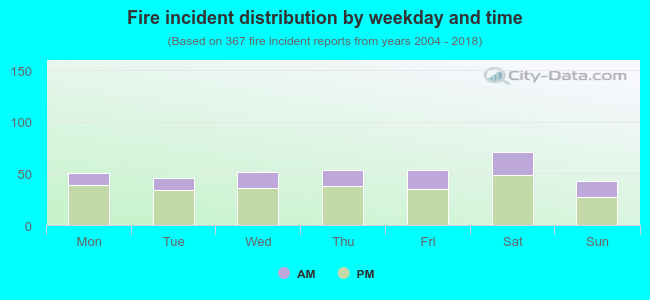 30.0% incidents where reported in the morning and 70.0% in the evening. The most fires (19.3%) took place on Saturday, and the least (11.7%) on Sunday.
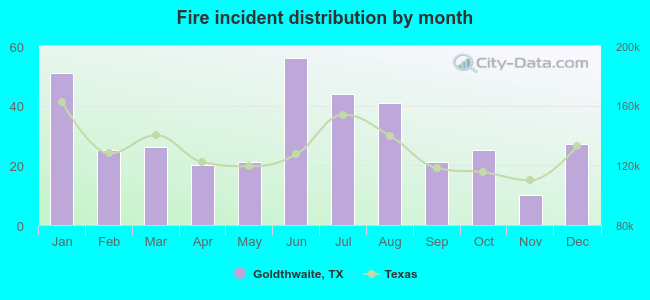 Based on the 367 fire incidents from years 2004 - 2018 most fires (15.3%) took place during June, and the least (2.7%) in November.
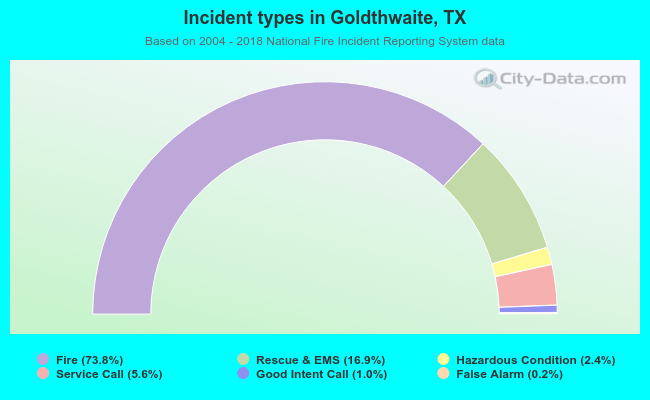 Out of all 497 cases reported during the years 2004 - 2018, the most belonged to the categories: Fire (73.8%), Overpressure Rupture (16.9%), and Hazardous Condition (5.6%).
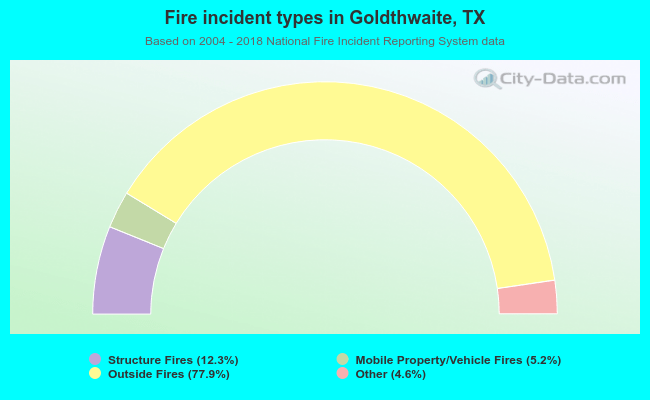 When looking into fire subcategories, the most incidents belonged to: Outside Fires (77.9%), and Structure Fires (12.3%).