Gray: Fire Incidents, Louisiana (LA)
Where are fire incidents reported in Gray, LA
Something went wrong! Please refresh the page.
|
| |||||||||||||||||||||||||||||||||||||||||||||||||||||||||||||||||||||||||||||||||||||||||||||||||||||||||||||
2002 - 2018 National Fire Incident Reporting System (NFIRS) incidents
- Incident types reported to NFIRS in Gray, LA
- 29636.3%Fire
- 24730.3%Rescue & EMS
- 10412.7%Hazardous Condition
- 789.6%False Alarm
- 738.9%Good Intent Call
- 111.3%Service Call
- 30.4%Severe Weather
- 20.2%Overpressure Rupture
- 20.2%Special Incident
- Fire incident types reported to NFIRS in Gray, LA
- 14649.3%Outside Fires
- 10234.5%Structure Fires
- 4314.5%Mobile Property/Vehicle Fires
- 51.7%Other
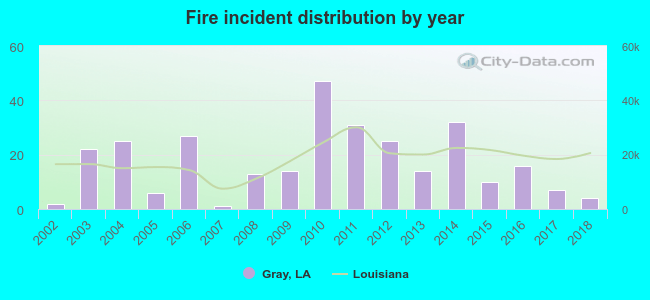 Based on the data from the years 2002 - 2018 the average number of fire incidents per year is 17. The highest number of fire incidents - 47 took place in 2010, and the least - 1 in 2007. The data has an increasing trend.
The average number of yearly fire incidents per 10k residents in Gray, LA compared to nearest cities:
(Note: Based on data for the last 3 years, including only cities with population 5,000 and above)
| Gray: | 16.1 |
| Central: | 0.7 |
| Schriever: | 20.9 |
| Houma: | 70.9 |
| Thibodaux: | 55.5 |
| Raceland: | 64.4 |
| Morgan City: | 8.9 |
| Larose: | 45.0 |
| Cut Off: | 59.1 |
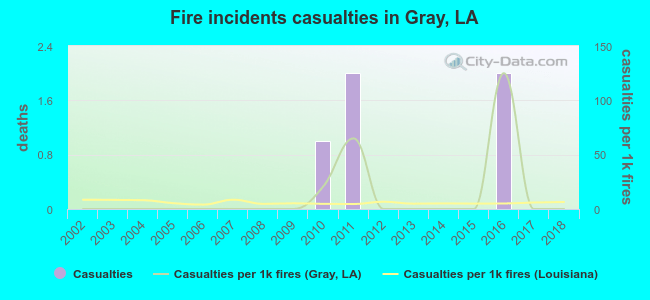 Based on the reports from the years 2002 - 2018 the average number of fire-related yearly casualties is 0. The highest number of injuries - 2 took place in 2011, and the lowest - 0 in 2002. The data has a constant trend.
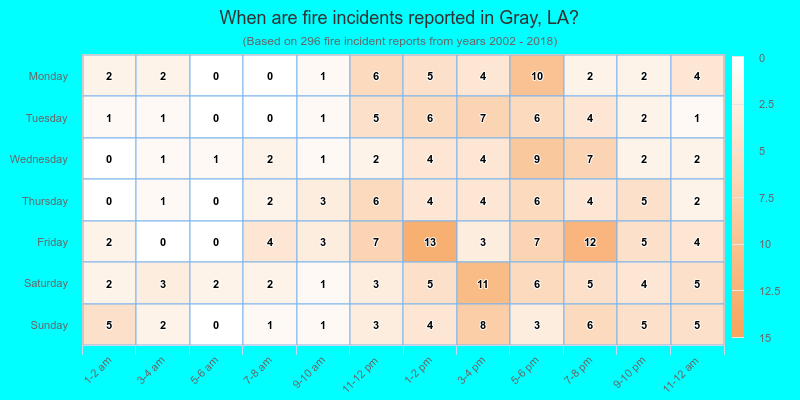
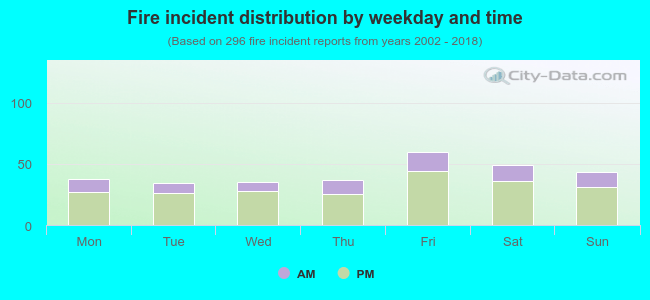 26.7% incidents where reported in the morning and 73.3% in the evening. The most fires (20.3%) took place on Friday, and the least (11.5%) on Tuesday.
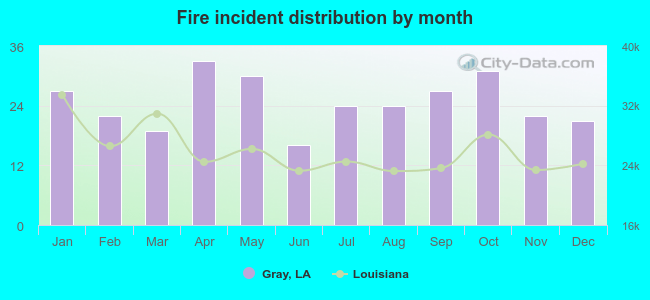 According to the 296 fire incidents from years 2002 - 2018 most fires (11.1%) took place during April, and the least (5.4%) in June.
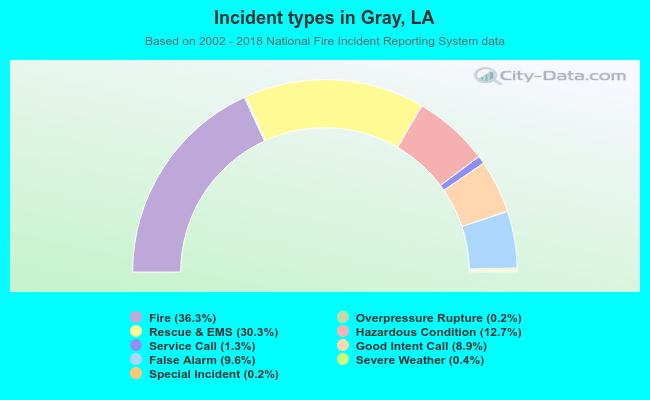 Out of all 816 cases reported during the years 2002 - 2018, the most belonged to the categories: Fire (36.3%), Rescue & EMS (30.3%), and Hazardous Condition (12.7%).
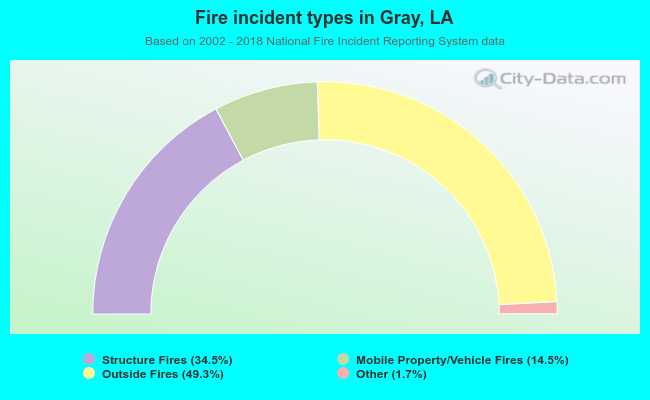 When looking into fire subcategories, the most reports belonged to: Outside Fires (49.3%), and Structure Fires (34.5%).