Great Neck: Fire Incidents, New York (NY)
Where are fire incidents reported in Great Neck, NY
Something went wrong! Please refresh the page.
|
| |||||||||||||||||||||||||||||||||||||||||||||||||||||||||||||||||||||||||||||||||||||||||||||||||||||||||||||
2005 - 2018 National Fire Incident Reporting System (NFIRS) incidents
- Incident types reported to NFIRS in Great Neck, NY
- 7,72654.0%Rescue & EMS
- 2,58818.1%False Alarm
- 1,76912.4%Hazardous Condition
- 1,1878.3%Good Intent Call
- 5453.8%Service Call
- 4523.2%Fire
- 150.1%Overpressure Rupture
- Fire incident types reported to NFIRS in Great Neck, NY
- 25456.2%Structure Fires
- 14231.4%Outside Fires
- 347.5%Other
- 224.9%Mobile Property/Vehicle Fires
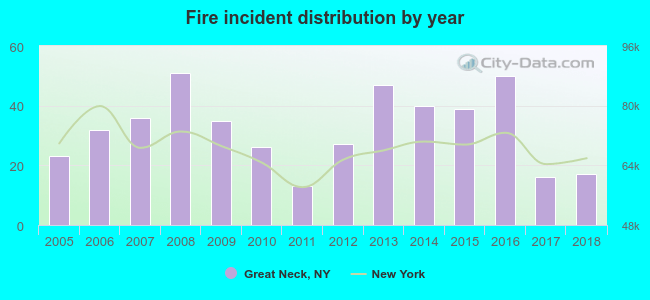 According to the data from the years 2005 - 2018 the average number of fires per year is 32. The highest number of reported fires - 51 took place in 2008, and the least - 13 in 2011. The data has a decreasing trend.
The average number of yearly fire incidents per 10k residents in Great Neck, NY compared to nearest cities:
(Note: Based on data for the last 3 years, including only cities with population 5,000 and above)
| Great Neck: | 27.3 |
| Great Neck Plaza: | 2.9 |
| Manhasset: | 1.2 |
| Manorhaven: | 25.4 |
| Port Washington: | 38.9 |
| North Hills: | 1.9 |
| North New Hyde Park: | 6.4 |
| Albertson: | 3.9 |
| Roslyn Heights: | 6.6 |
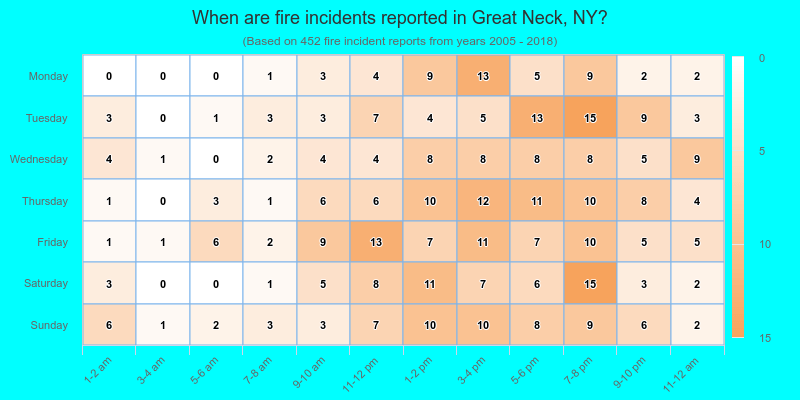
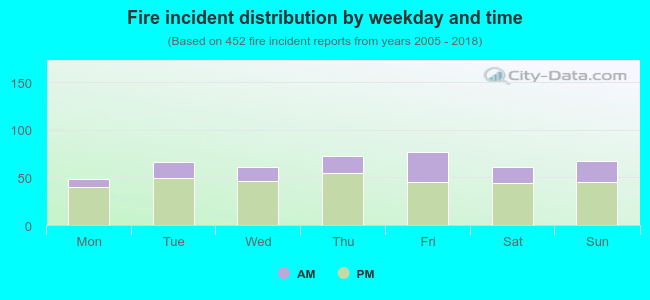 28.3% incidents where reported in the morning and 71.7% in the evening. The most fires (17.0%) took place on Friday, and the least (10.6%) on Monday.
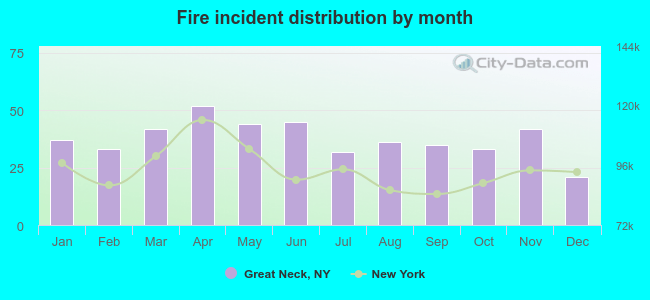 According to the 452 fires from years 2005 - 2018 most fires (11.5%) took place during April, and the least (4.6%) in December.
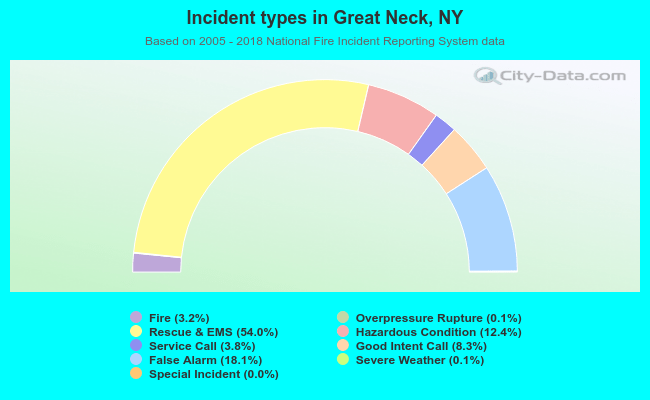 Out of all 14,298 cases reported during the years 2005 - 2018, the most belonged to the categories: Rescue & EMS (54.0%), False Alarm (18.1%), and Hazardous Condition (12.4%).
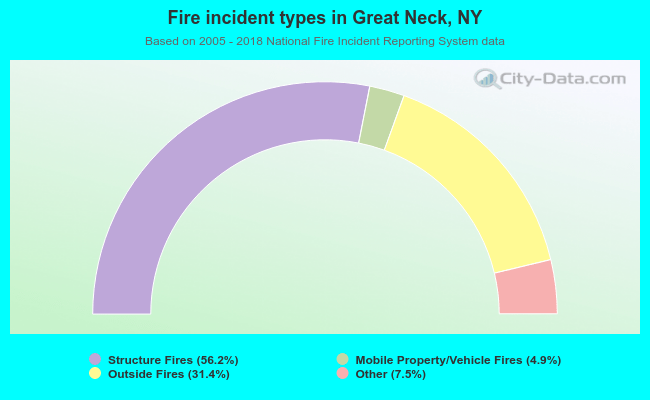 When looking into fire subcategories, the most incidents belonged to: Structure Fires (56.2%), and Outside Fires (31.4%).