Greenwood Village: Fire Incidents, Colorado (CO)
Where are fire incidents reported in Greenwood Village, CO
Something went wrong! Please refresh the page.
|
| |||||||||||||||||||||||||||||||||||||||||||||||||||||||||||||||||||||||||||||||||||||||||||||||||||||||||||||
2002 - 2018 National Fire Incident Reporting System (NFIRS) incidents
- Incident types reported to NFIRS in Greenwood Village, CO
- 4,76758.3%Rescue & EMS
- 1,14914.0%False Alarm
- 7959.7%Good Intent Call
- 7409.0%Service Call
- 5126.3%Hazardous Condition
- 2152.6%Fire
- Fire incident types reported to NFIRS in Greenwood Village, CO
- 9443.7%Structure Fires
- 6831.6%Outside Fires
- 5123.7%Mobile Property/Vehicle Fires
- 20.9%Other
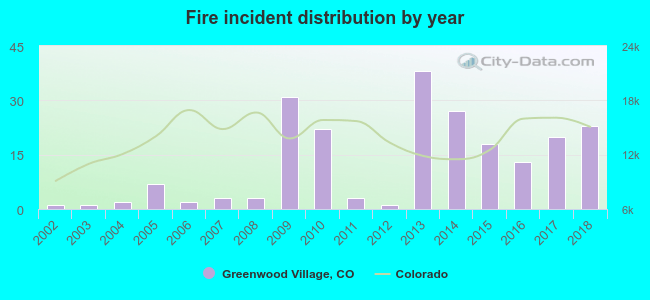 According to the data from the years 2002 - 2018 the average number of fire incidents per year is 13. The highest number of reported fire incidents - 38 took place in 2013, and the least - 1 in 2002. The data has a rising trend.
The average number of yearly fire incidents per 10k residents in Greenwood Village, CO compared to nearest cities:
(Note: Based on data for the last 3 years, including only cities with population 5,000 and above)
| Greenwood Village: | 12.1 |
| Cherry Hills Village: | 13.5 |
| Centennial: | 6.9 |
| Lone Tree: | 25.3 |
| Englewood: | 46.5 |
| Littleton: | 45.4 |
| Highlands Ranch: | 5.0 |
| Sheridan: | 45.9 |
| Glendale: | 18.9 |
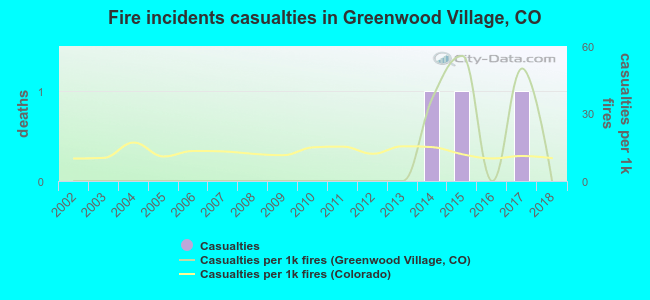 Based on the data from the years 2002 - 2018 the average number of fire-related yearly casualties is 0. The highest number of reported casualties - 1 took place in 2014, and the lowest - 0 in 2002. The data has a constant trend.
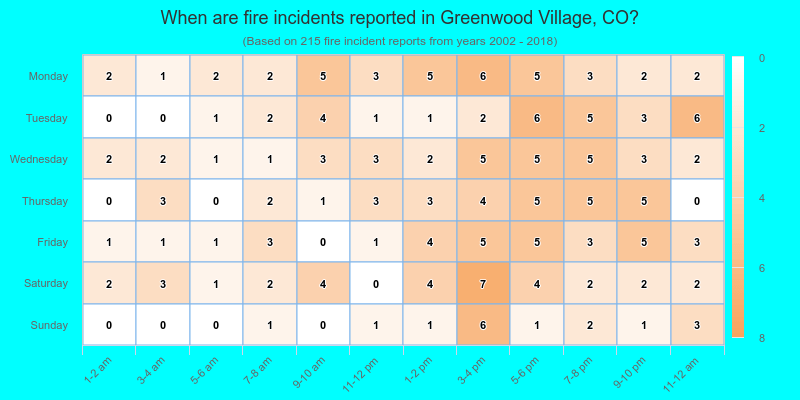
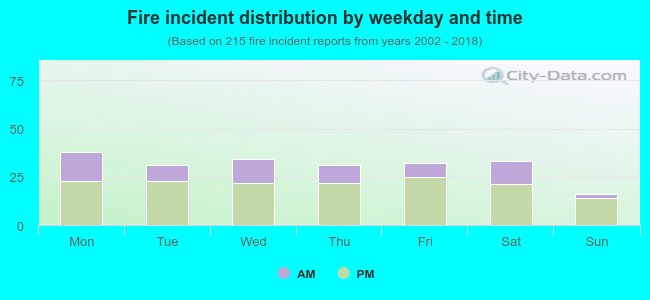 30.2% incidents where reported in the morning and 69.8% in the evening. The most fires (17.7%) took place on Monday, and the least (7.4%) on Sunday.
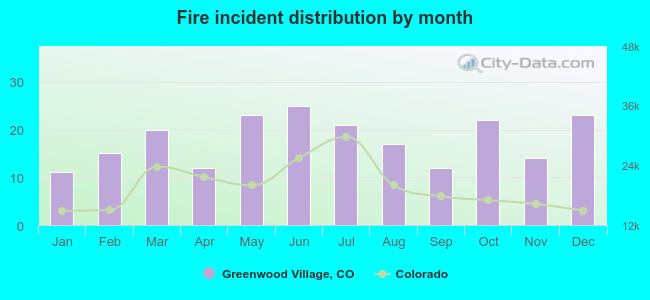 Based on the 215 reports from years 2002 - 2018 most fires (11.6%) took place during June, and the least (5.1%) in January.
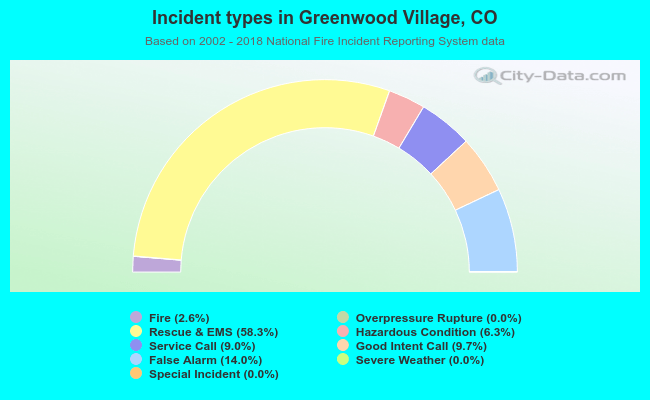 Out of all 8,183 cases reported during the years 2002 - 2018, the most belonged to the categories: Rescue & EMS (58.3%), False Alarm (14.0%), and Good Intent Call (9.7%).
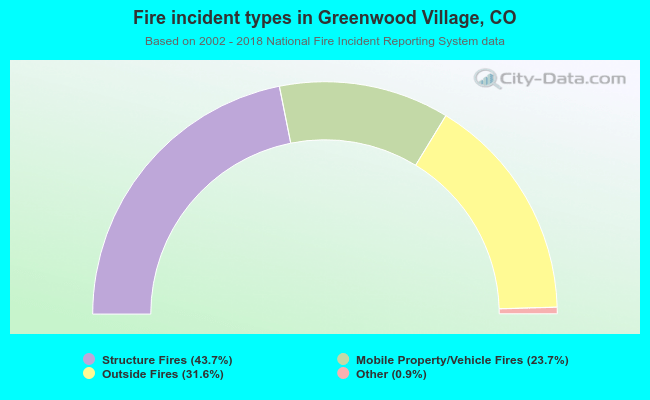 When looking into fire subcategories, the most incidents belonged to: Structure Fires (43.7%), and Outside Fires (31.6%).