Grosse Pointe Park: Fire Incidents, Michigan (MI)
Where are fire incidents reported in Grosse Pointe Park, MI
Something went wrong! Please refresh the page.
|
| |||||||||||||||||||||||||||||||||||||||||||||||||||||||||||||||||||||||||||||||||||||||||||||||||||||||||||||
2002 - 2018 National Fire Incident Reporting System (NFIRS) incidents
- Incident types reported to NFIRS in Grosse Pointe Park, MI
- 36237.0%Fire
- 27628.2%False Alarm
- 17718.1%Hazardous Condition
- 13213.5%Good Intent Call
- 293.0%Service Call
- 20.2%Rescue & EMS
- Fire incident types reported to NFIRS in Grosse Pointe Park, MI
- 24768.2%Structure Fires
- 7119.6%Outside Fires
- 328.8%Mobile Property/Vehicle Fires
- 123.3%Other
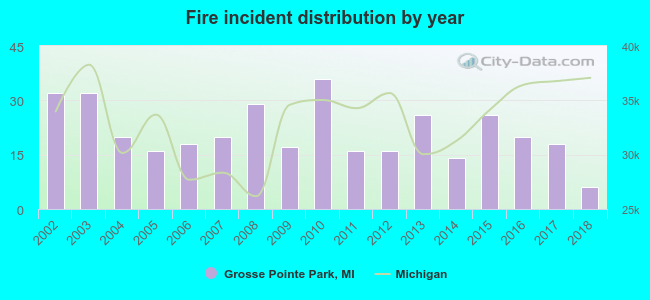 According to the data from the years 2002 - 2018 the average number of fires per year is 21. The highest number of reported fires - 36 took place in 2010, and the least - 6 in 2018. The data has a dropping trend.
The average number of yearly fire incidents per 10k residents in Grosse Pointe Park, MI compared to nearest cities:
(Note: Based on data for the last 3 years, including only cities with population 5,000 and above)
| Grosse Pointe Park: | 13.0 |
| Grosse Pointe: | 5.7 |
| Grosse Pointe Farms: | 14.0 |
| Harper Woods: | 17.7 |
| Grosse Pointe Woods: | 17.1 |
| Eastpointe: | 32.2 |
| Hamtramck: | 73.8 |
| Center Line: | 78.6 |
| Roseville: | 29.2 |
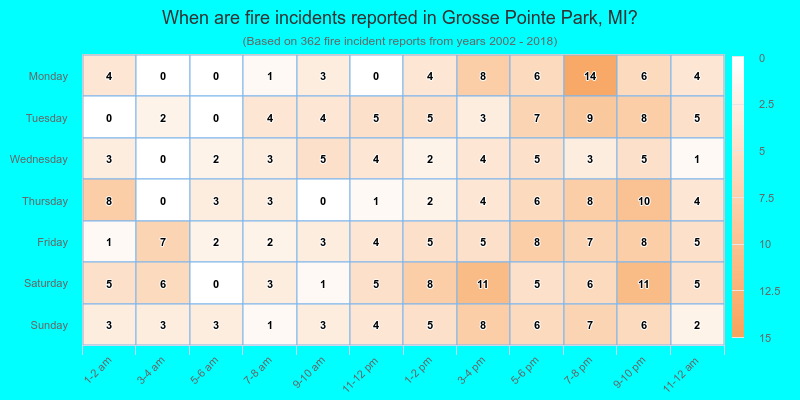
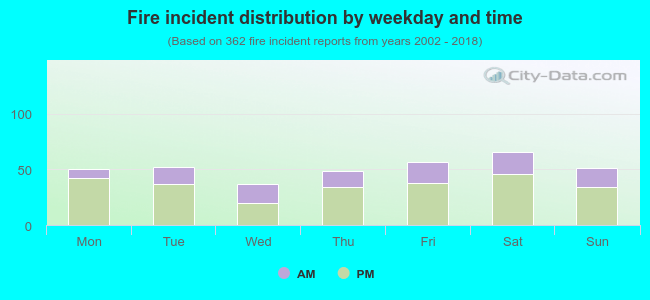 30.7% incidents where reported in the morning and 69.3% in the evening. The most fires (18.2%) took place on Saturday, and the least (10.2%) on Wednesday.
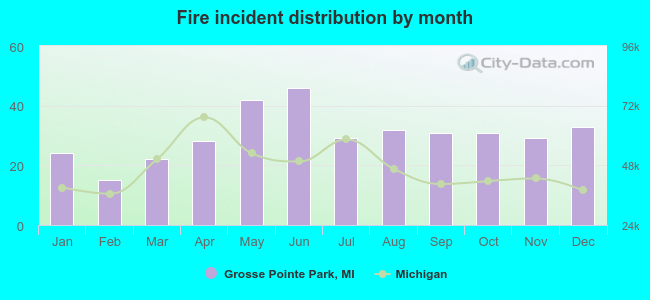 According to the 362 fires from years 2002 - 2018 most fires (12.7%) took place during June, and the least (4.1%) in February.
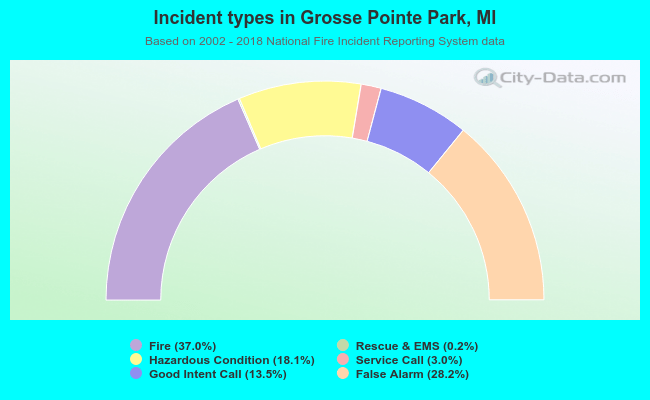 Out of all 978 cases reported during the years 2002 - 2018, the most belonged to the categories: Fire (37.0%), Good Intent Call (28.2%), and Rescue & EMS (18.1%).
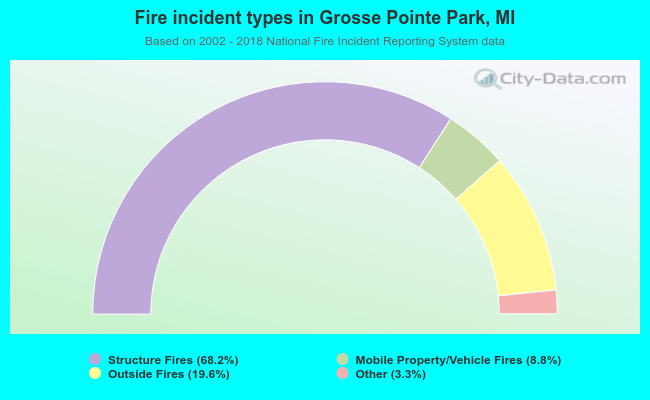 When looking into fire subcategories, the most reports belonged to: Structure Fires (68.2%), and Outside Fires (19.6%).