Hadley: Fire Incidents, New York (NY)
Where are fire incidents reported in Hadley, NY
Something went wrong! Please refresh the page.
|
| |||||||||||||||||||||||||||||||||||||||||||||||||||||||||||||||||||||||||||||||||||||||||||||||||||||||||||||
2004 - 2018 National Fire Incident Reporting System (NFIRS) incidents
- Incident types reported to NFIRS in Hadley, NY
- 23740.4%Hazardous Condition
- 12020.5%Fire
- 6611.3%Rescue & EMS
- 6410.9%False Alarm
- 539.0%Good Intent Call
- 427.2%Service Call
- 20.3%Severe Weather
- 10.2%Overpressure Rupture
- 10.2%Special Incident
- Fire incident types reported to NFIRS in Hadley, NY
- 5747.5%Structure Fires
- 4033.3%Outside Fires
- 1815.0%Mobile Property/Vehicle Fires
- 54.2%Other
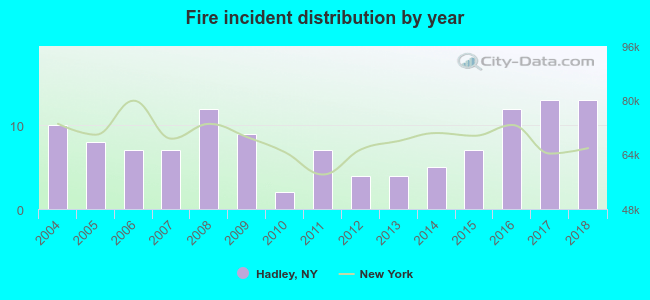 According to the data from the years 2004 - 2018 the average number of fire incidents per year is 8. The highest number of fires - 13 took place in 2017, and the least - 2 in 2010. The data has an increasing trend.
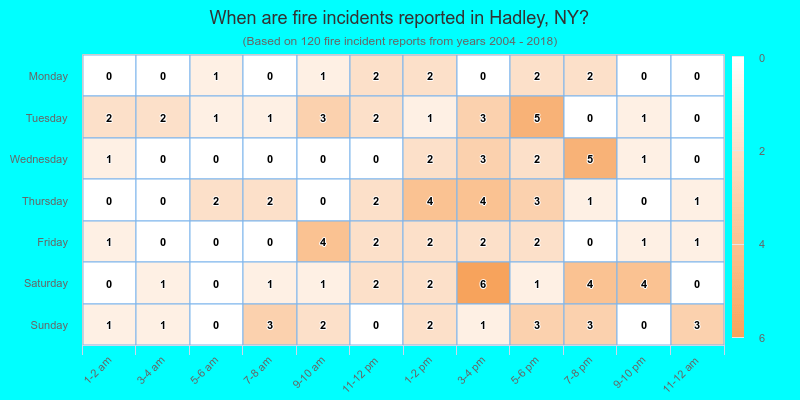
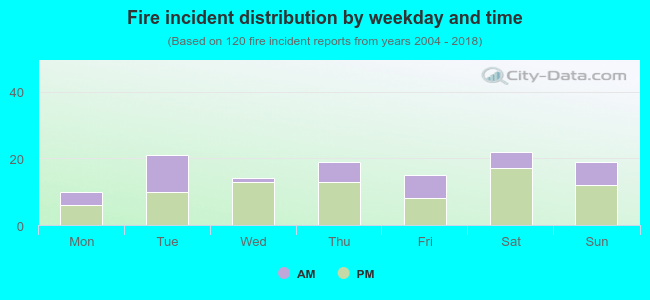 34.2% incidents where reported in the morning and 65.8% in the evening. The most fires (18.3%) took place on Saturday, and the least (8.3%) on Monday.
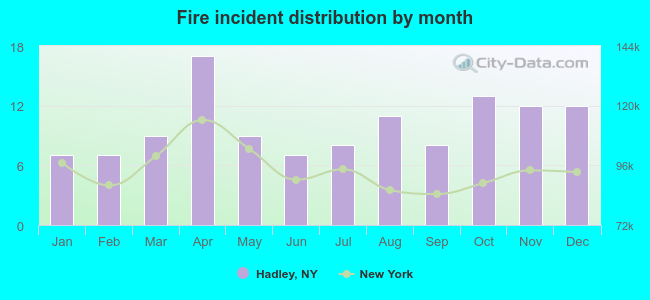 Based on the 120 incident reports from years 2004 - 2018 most fires (14.2%) took place during April, and the least (5.8%) in January.
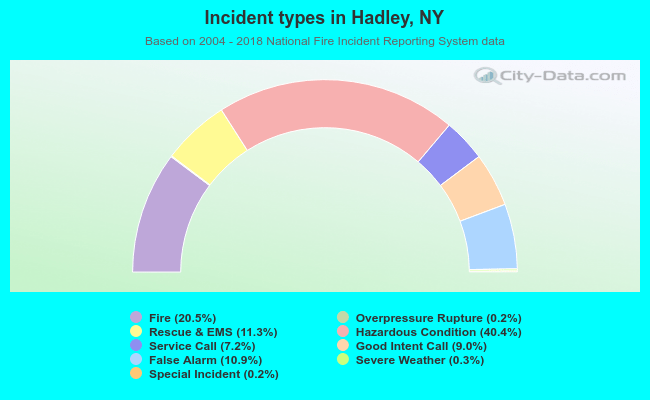 Out of all 586 cases reported during the years 2004 - 2018, the most belonged to the categories: Hazardous Condition (40.4%), Fire (20.5%), and Rescue & EMS (11.3%).
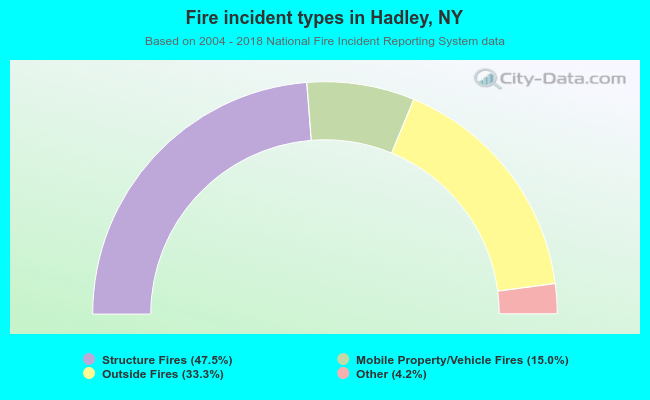 When looking into fire subcategories, the most incidents belonged to: Structure Fires (47.5%), and Outside Fires (33.3%).