Haltom City: Fire Incidents, Texas (TX)
Where are fire incidents reported in Haltom City, TX
Something went wrong! Please refresh the page.
| Fire incidents reported | |
|---|---|
| Sreet name | Count |
| DENTON HWY | 308 |
| BELKNAP ST | 224 |
| BEACH ST | 150 |
| AIRPORT FRWY | 140 |
| HALTOM RD | 140 |
| AIRPORT FWY | 112 |
| BONANZA DR | 100 |
| BROADWAY AVE | 94 |
| BAKER BLVD | 90 |
| LOOP 820 | 90 |
| SPRINGLAKE PKWY | 90 |
| MIDWAY RD | 70 |
| BERNICE ST | 66 |
| LAYTON AVE | 60 |
| CARSON ST | 58 |
| COVENTRY PARK DR | 58 |
| STANLEY KELLER RD | 58 |
| DAYTON ST | 50 |
| FINCHER RD | 50 |
| NE LOOP 820 | 50 |
| MEADOW OAKS DR | 48 |
| EASTRIDGE DR | 42 |
| NORTHERN CROSS BLVD | 42 |
| MEACHAM BLVD | 40 |
| NADINE DR | 38 |
| NORTH HILLS DR | 38 |
| DANA DR | 36 |
| DIAMOND OAKS DR | 36 |
| 28TH ST | 34 |
| BLACK DR | 34 |
| Other | 399 |
2004 - 2018 National Fire Incident Reporting System (NFIRS) incidents
- Incident types reported to NFIRS in Haltom City, TX
- 10,00845.4%Rescue & EMS
- 3,36915.3%Hazardous Condition
- 2,84512.9%Fire
- 2,1889.9%Good Intent Call
- 2,1809.9%Service Call
- 1,2575.7%False Alarm
- 1470.7%Special Incident
- 560.3%Overpressure Rupture
- Fire incident types reported to NFIRS in Haltom City, TX
- 1,22142.9%Outside Fires
- 1,02736.1%Structure Fires
- 43015.1%Mobile Property/Vehicle Fires
- 1675.9%Other
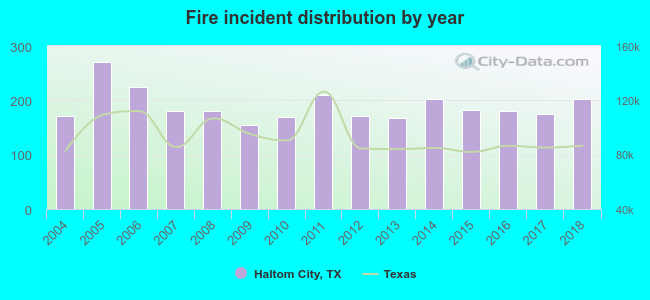 According to the data from the years 2004 - 2018 the average number of fire incidents per year is 189. The highest number of fires - 270 took place in 2005, and the least - 155 in 2009. The data has an increasing trend.
The average number of yearly fire incidents per 10k residents in Haltom City, TX compared to nearest cities:
(Note: Based on data for the last 3 years, including only cities with population 5,000 and above)
| Haltom City: | 42.3 |
| Richland Hills: | 17.8 |
| Watauga: | 29.2 |
| North Richland Hills: | 22.3 |
| Hurst: | 28.8 |
| Saginaw: | 31.8 |
| Fort Worth: | 11.7 |
| River Oaks: | 21.3 |
| Bedford: | 29.2 |
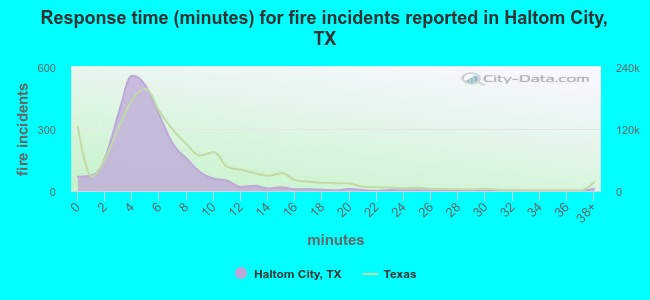 The median response time based on all reported fire incidents is 5 minutes. This is lower than the state median value.
The median response time in Haltom City, TX compared to nearest cities:
(Note: Based on data for all years, including only cities with at least 500 fire incidents)
| Haltom City: | 5 minutes |
| Richland Hills: | 5 minutes |
| Watauga: | 6 minutes |
| North Richland Hills: | 6 minutes |
| Hurst: | 5 minutes |
| Saginaw: | 5 minutes |
| Fort Worth: | 4 minutes |
| Bedford: | 4 minutes |
| Keller: | 6 minutes |
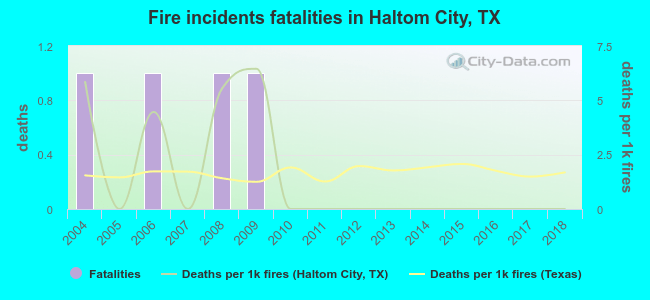 Based on the reports from the years 2004 - 2018 the average number of fire-related fatalities per year is 0. The highest number of deaths - 1 took place in 2004, and the lowest - 0 in 2005. The data has a declining trend.
The average number of deaths per 1,000 fire incidents is 1. This indicator was the highest - 6 in 2009, and the lowest 0 in 2005. The trend for fatalities per 1,000 fires is declining. Compared to the Texas value the number of fatalities per 1,000 fires is about the same.
Based on the reports from the years 2004 - 2018 the average number of fire-related fatalities per year is 0. The highest number of deaths - 1 took place in 2004, and the lowest - 0 in 2005. The data has a declining trend.
The average number of deaths per 1,000 fire incidents is 1. This indicator was the highest - 6 in 2009, and the lowest 0 in 2005. The trend for fatalities per 1,000 fires is declining. Compared to the Texas value the number of fatalities per 1,000 fires is about the same.Deaths per 1,000 incidents in Haltom City, TX compared to nearest cities:
(Note: Based on data for all years, including only cities with at least 2,500 fire incidents)
| Haltom City: | 1.4 |
| Fort Worth: | 1.9 |
| Bedford: | 1.5 |
| Euless: | 1.3 |
| Arlington: | 1.9 |
| Grapevine: | 0.6 |
| Azle: | 0.7 |
| Grand Prairie: | 3.9 |
| Irving: | 0.7 |
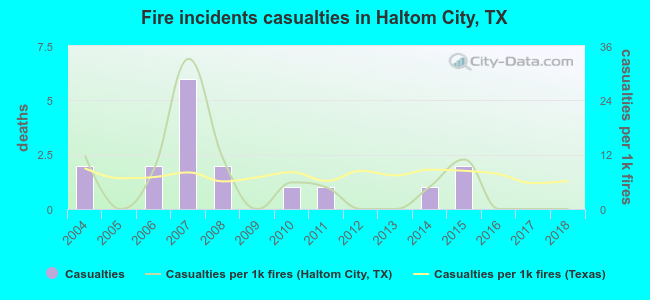 According to the reports from the years 2004 - 2018 the average number of fire-related yearly casualties is 1. The highest number of reported injuries - 6 took place in 2007, and the lowest - 0 in 2005. The data has a declining trend.
The average number of casualties per 1,000 fires is 6. This indicator was the highest - 33 in 2007, and the lowest 0 in 2005. The trend for casualties per 1,000 incidents is declining. Compared to the Texas value the number of injuries per 1,000 fire incidents is lower.
According to the reports from the years 2004 - 2018 the average number of fire-related yearly casualties is 1. The highest number of reported injuries - 6 took place in 2007, and the lowest - 0 in 2005. The data has a declining trend.
The average number of casualties per 1,000 fires is 6. This indicator was the highest - 33 in 2007, and the lowest 0 in 2005. The trend for casualties per 1,000 incidents is declining. Compared to the Texas value the number of injuries per 1,000 fire incidents is lower.Casualties per 1,000 incidents in Haltom City, TX compared to nearest cities:
(Note: Based on data for all years, including only cities with at least 500 fire incidents)
| Haltom City: | 6.0 |
| Richland Hills: | 9.8 |
| Watauga: | 3.6 |
| North Richland Hills: | 23.5 |
| Hurst: | 8.2 |
| Saginaw: | 8.3 |
| Fort Worth: | 9.7 |
| Bedford: | 30.9 |
| Keller: | 17.7 |
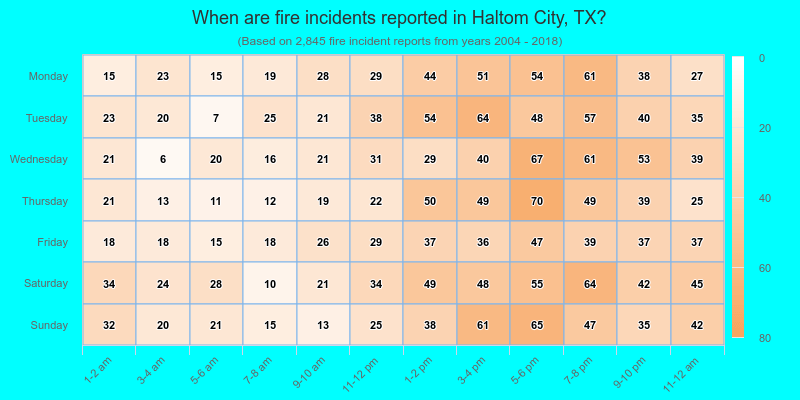
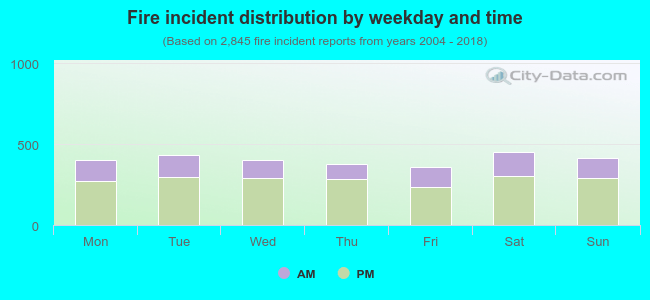 30.8% incidents where reported in the morning and 69.2% in the evening. The most fires (16.0%) took place on Saturday, and the least (12.5%) on Friday.
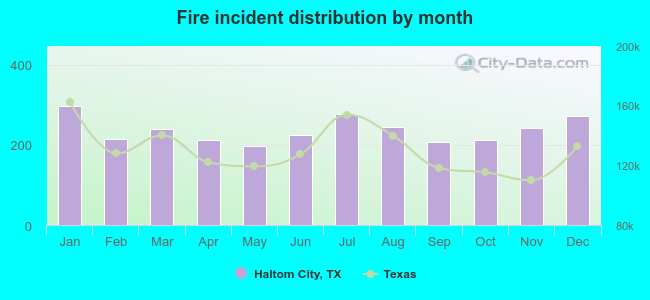 According to the 2,845 fires from years 2004 - 2018 most fires (10.5%) took place during January, and the least (7.0%) in May.
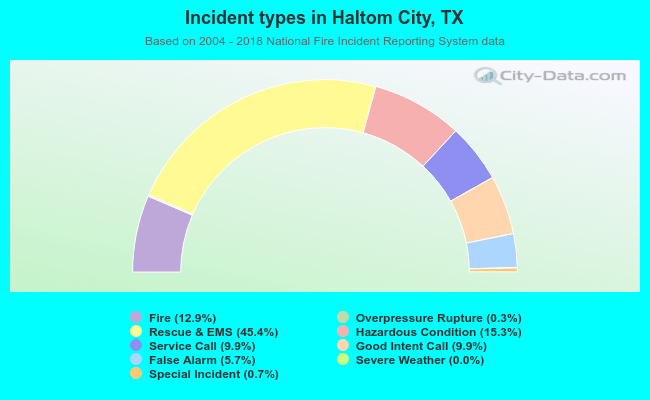 Out of all 22,057 cases reported during the years 2004 - 2018, the most belonged to the categories: Rescue & EMS (45.4%), Hazardous Condition (15.3%), and Fire (12.9%).
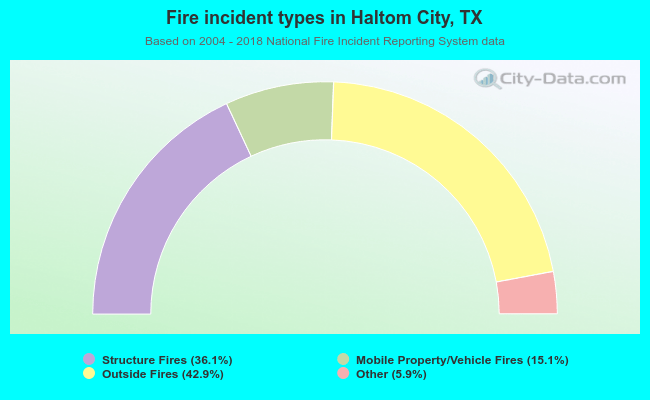 When looking into fire subcategories, the most incidents belonged to: Outside Fires (42.9%), and Structure Fires (36.1%).