Hamilton: Fire Incidents, Ohio (OH)
Where are fire incidents reported in Hamilton, OH
Something went wrong! Please refresh the page.
| Fire incidents reported | |
|---|---|
| Sreet name | Count |
| PRINCETON RD | 188 |
| ERIE BLVD | 170 |
| HIGH ST | 154 |
| B ST | 124 |
| MAIN ST | 122 |
| WASHINGTON BLVD | 112 |
| FRANKLIN ST | 110 |
| EAST AVE | 104 |
| ROSS AVE | 86 |
| 2ND ST | 84 |
| HAMILTON RICHMOND RD | 80 |
| OLD OXFORD RD | 76 |
| DAYTON ST | 74 |
| EATON AVE | 74 |
| MILLVILLE OXFORD RD | 74 |
| LUDLOW ST | 72 |
| SYCAMORE ST | 70 |
| HEATON ST | 68 |
| PARKAMO AVE | 66 |
| PLEASANT AVE | 66 |
| SHULER AVE | 66 |
| 7TH ST | 62 |
| DIXIE HWY | 62 |
| 8TH ST | 60 |
| HAMILTON-MASON RD | 60 |
| TYLERSVILLE RD | 60 |
| VINE ST | 60 |
| PATER AVE | 56 |
| WEST ELKTON RD | 56 |
| 11TH ST | 54 |
| Other | 3,116 |
2002 - 2018 National Fire Incident Reporting System (NFIRS) incidents
- Incident types reported to NFIRS in Hamilton, OH
- 46,03165.9%Rescue & EMS
- 7,23210.4%Hazardous Condition
- 5,6868.1%Fire
- 4,1485.9%Good Intent Call
- 3,8195.5%Service Call
- 2,7023.9%False Alarm
- 1290.2%Severe Weather
- Fire incident types reported to NFIRS in Hamilton, OH
- 2,53844.6%Structure Fires
- 2,42942.7%Outside Fires
- 68312.0%Mobile Property/Vehicle Fires
- 360.6%Other
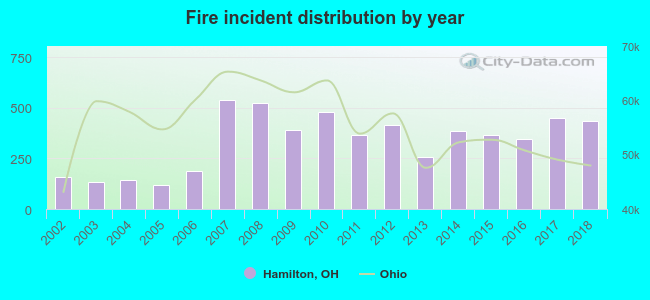 According to the data from the years 2002 - 2018 the average number of fires per year is 334. The highest number of fire incidents - 537 took place in 2007, and the least - 119 in 2005. The data has a rising trend.
The average number of yearly fire incidents per 10k residents in Hamilton, OH compared to nearest cities:
(Note: Based on data for the last 3 years, including only cities with population 5,000 and above)
| Hamilton: | 65.6 |
| Fairfield: | 23.7 |
| Forest Park: | 42.0 |
| Trenton: | 34.0 |
| Springdale: | 78.8 |
| Monroe: | 33.4 |
| Mount Healthy: | 2.7 |
| Sharonville: | 65.8 |
| North College Hill: | 23.5 |
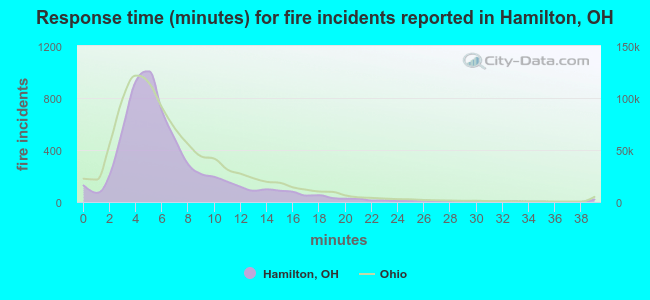 The median response time based on all reported fire incidents is 5 minutes. This is lower compared to the Ohio median value.
The median response time in Hamilton, OH compared to nearest cities:
(Note: Based on data for all years, including only cities with at least 500 fire incidents)
| Hamilton: | 5 minutes |
| Fairfield: | 5 minutes |
| Forest Park: | 5 minutes |
| Trenton: | 6 minutes |
| Springdale: | 5 minutes |
| Woodlawn: | 5 minutes |
| Monroe: | 5 minutes |
| Sharonville: | 6 minutes |
| Lincoln Heights: | 5 minutes |
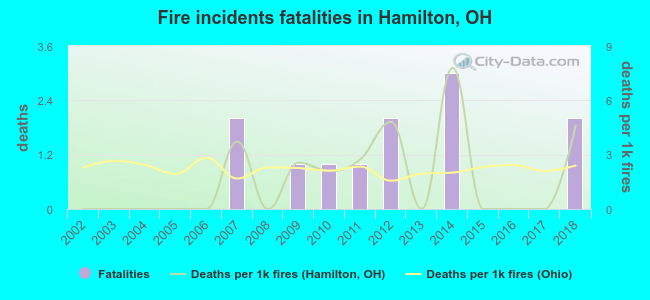 Based on the reports from the years 2002 - 2018 the average number of fire-related fatalities per year is 1. The highest number of reported deaths - 3 took place in 2014, and the lowest - 0 in 2002. The data has an increasing trend.
The average number of deaths per 1,000 fire incidents is 2. This indicator was the highest - 8 in 2014, and the lowest 0 in 2002. The trend for fatalities per 1,000 fire incidents is increasing. Compared to the Ohio value the number of fatalities per 1,000 fires is about the same.
Based on the reports from the years 2002 - 2018 the average number of fire-related fatalities per year is 1. The highest number of reported deaths - 3 took place in 2014, and the lowest - 0 in 2002. The data has an increasing trend.
The average number of deaths per 1,000 fire incidents is 2. This indicator was the highest - 8 in 2014, and the lowest 0 in 2002. The trend for fatalities per 1,000 fire incidents is increasing. Compared to the Ohio value the number of fatalities per 1,000 fires is about the same.Deaths per 1,000 incidents in Hamilton, OH compared to nearest cities:
(Note: Based on data for all years, including only cities with at least 2,500 fire incidents)
| Hamilton: | 2.1 |
| Middletown: | 2.1 |
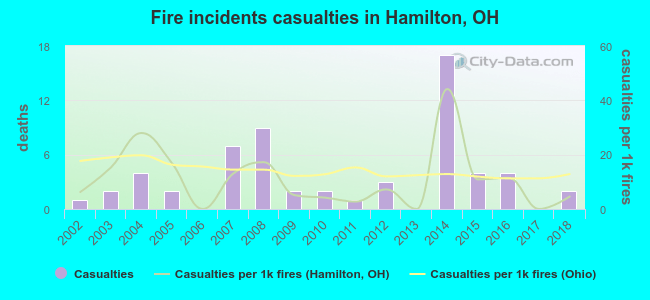 Based on the data from the years 2002 - 2018 the average number of fire-related casualties per year is 4. The highest number of reported injuries - 17 took place in 2014, and the lowest - 0 in 2006. The data has an increasing trend.
The average number of injuries per 1,000 fire incidents is 11. This indicator was the highest - 44 in 2014, and the lowest 0 in 2006. The trend for injuries per 1,000 fire incidents is declining. Compared to the Ohio value the number of casualties per 1,000 fire incidents is lower.
Based on the data from the years 2002 - 2018 the average number of fire-related casualties per year is 4. The highest number of reported injuries - 17 took place in 2014, and the lowest - 0 in 2006. The data has an increasing trend.
The average number of injuries per 1,000 fire incidents is 11. This indicator was the highest - 44 in 2014, and the lowest 0 in 2006. The trend for injuries per 1,000 fire incidents is declining. Compared to the Ohio value the number of casualties per 1,000 fire incidents is lower.Casualties per 1,000 incidents in Hamilton, OH compared to nearest cities:
(Note: Based on data for all years, including only cities with at least 500 fire incidents)
| Hamilton: | 10.6 |
| Fairfield: | 10.8 |
| Forest Park: | 26.3 |
| Trenton: | 7.3 |
| Springdale: | 21.1 |
| Woodlawn: | 3.8 |
| Monroe: | 20.9 |
| Sharonville: | 6.8 |
| Lincoln Heights: | 0.0 |
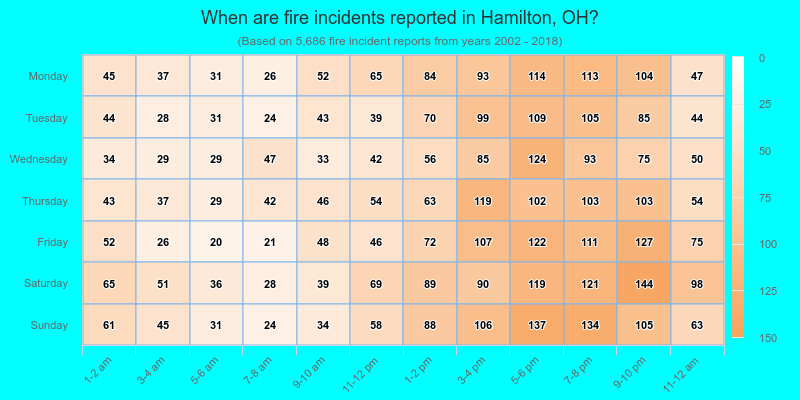
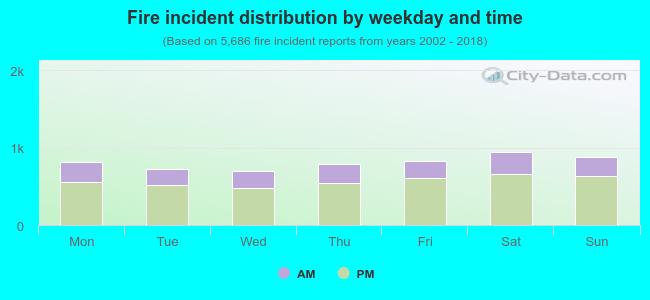 29.6% incidents where reported in the morning and 70.4% in the evening. The most fires (16.7%) took place on Saturday, and the least (12.3%) on Wednesday.
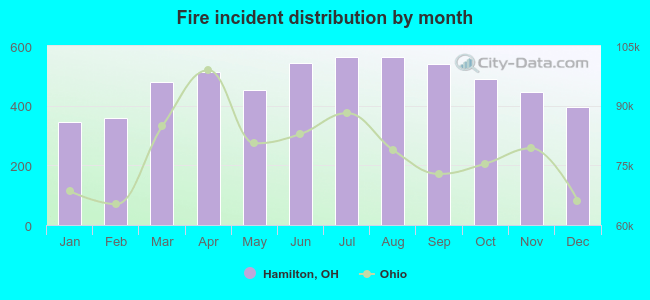 Based on the 5,686 fire incident reports from years 2002 - 2018 most fires (9.9%) took place during July, and the least (6.0%) in January.
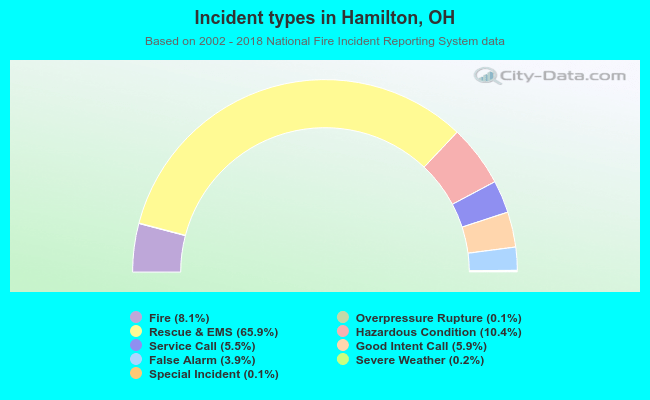 Out of all 69,853 cases reported during the years 2002 - 2018, the most belonged to the categories: Rescue & EMS (65.9%), Hazardous Condition (10.4%), and Fire (8.1%).
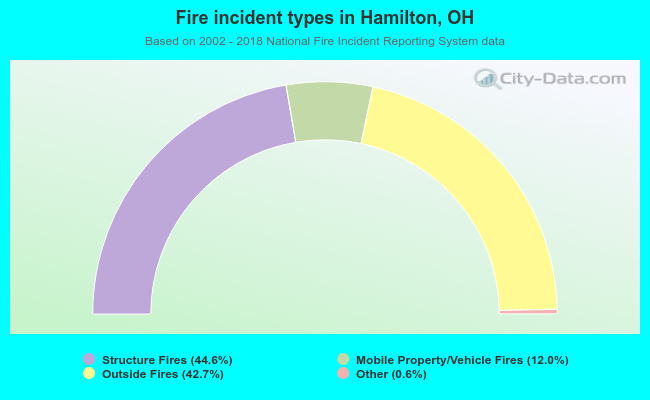 When looking into fire subcategories, the most reports belonged to: Structure Fires (44.6%), and Outside Fires (42.7%).