| Fire incidents reported |
|---|
| Sreet name | Count |
|---|
| LEXINGTON HILLS DR | 42 | | HARRIMAN HEIGHTS RD | 32 | | ST RT 17M | 26 | | BROOKSIDE DR | 16 | | MAIN ST | 16 | | LARKIN DRIVE | 14 | | HARRIMAN WOODS DR | 12 | | OXFORD LN | 10 | | SILVER MAPLES DR | 10 | | HERITAGE DR | 8 | | LARKIN DR | 8 | | BERWYNN RD | 6 | | CHURCH ST | 6 | | DRY HILL LAKE RD | 6 | | ORANGE TPKE | 6 | | ORCHARD HILL RD | 6 | | RIVER RD | 6 | | ROUTE 17 | 6 | | CONKLIN RD | 4 | | GROVE ST | 4 | | HARRIMAN HEIGHTS ROAD | 4 | | KENSINGTON WAY | 4 | | LEXINGTON HILL | 4 | | LEXINGTON HILLS | 4 | | MAHER ROAD | 4 |
| | | Fire incidents reported |
|---|
| Sreet name | Count |
|---|
| MAPLE AVE | 4 | | MEADOW AVE | 4 | | ORCHARD DR | 4 | | ORCHARD DRIVE | 4 | | ROUTE 17M | 4 | | SEVEN OAKS DR | 4 | | SILVER MAPLES DRIVE | 4 | | SNOOP ST | 4 | | SUMMIT AVE | 4 | | TURNBERRY CT | 4 | | WOODLAND RD | 4 | | ARDEN HOUSE RD | 2 | | ARDEN HOUSE ROAD | 2 | | BAILEY FARM RD | 2 | | BAKERTOWN RD | 2 | | BALMORAL CT | 2 | | CHIMMY RIDGE DR | 2 | | CIRCLE DR | 2 | | CLARK LN | 2 | | COMMERCE DR | 2 | | COUNTRY CT | 2 | | DOGWOOD LN | 2 | | EVERGREEN RD | 2 | | FAWNRIDGE CT | 2 | | |
|
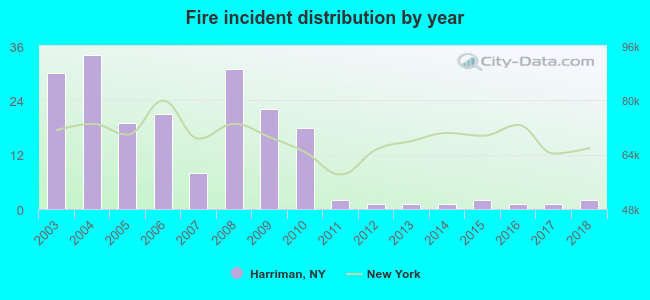 According to the data from the years 2003 - 2018 the average number of fire incidents per year is 12. The highest number of fires - 34 took place in 2004, and the least - 1 in 2012. The data has a decreasing trend.
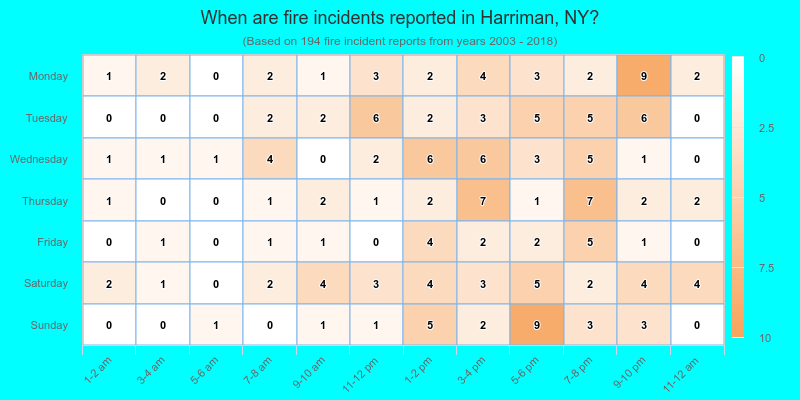
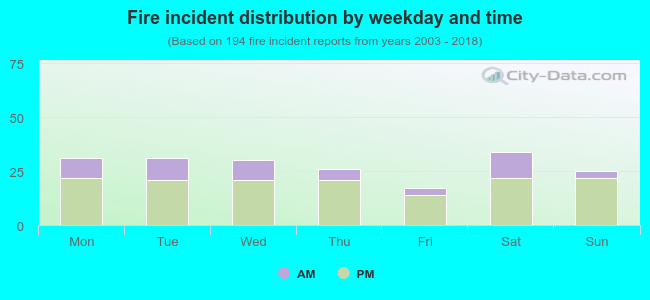 26.3% incidents where reported in the morning and 73.7% in the evening. The most fires (17.5%) took place on Saturday, and the least (8.8%) on Friday.
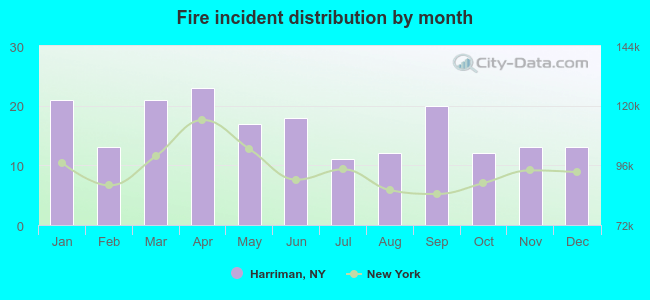 Based on the 194 incident reports from years 2003 - 2018 most fires (11.9%) took place during April, and the least (5.7%) in July.
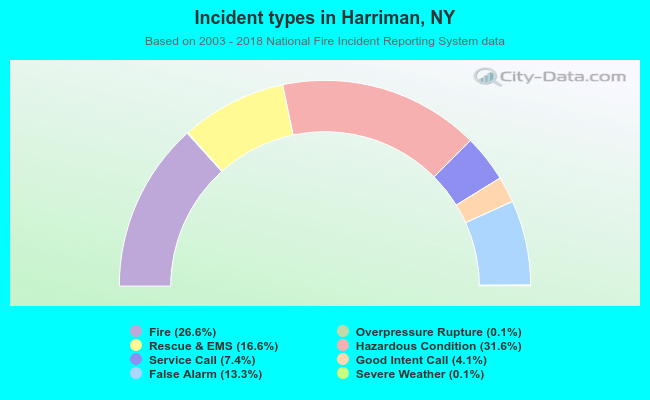 Out of all 728 cases reported during the years 2003 - 2018, the most belonged to the categories: Hazardous Condition (31.6%), Fire (26.6%), and Rescue & EMS (16.6%).
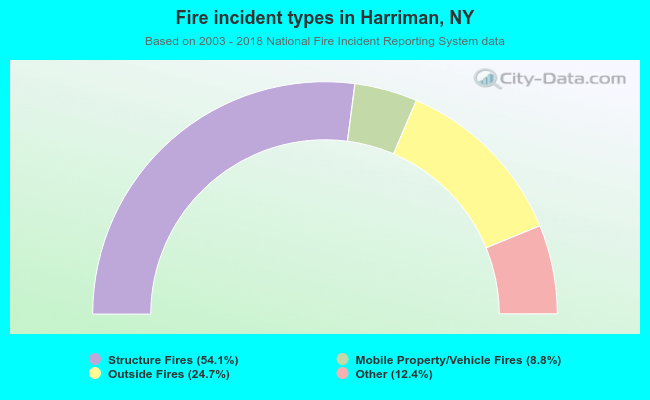 When looking into fire subcategories, the most incidents belonged to: Structure Fires (54.1%), and Outside Fires (24.7%).