Harrison: Fire Incidents, New York (NY)
Where are fire incidents reported in Harrison, NY
Something went wrong! Please refresh the page.
|
| |||||||||||||||||||||||||||||||||||||||||||||||||||||||||||||||||||||||||||||||||||||||||||||||||||||||||||||
2003 - 2018 National Fire Incident Reporting System (NFIRS) incidents
- Incident types reported to NFIRS in Harrison, NY
- 2,03639.9%False Alarm
- 1,51929.7%Hazardous Condition
- 52910.4%Service Call
- 4088.0%Rescue & EMS
- 3126.1%Fire
- 2555.0%Good Intent Call
- 210.4%Overpressure Rupture
- 170.3%Special Incident
- 120.2%Severe Weather
- Fire incident types reported to NFIRS in Harrison, NY
- 14245.5%Structure Fires
- 7724.7%Outside Fires
- 7524.0%Mobile Property/Vehicle Fires
- 185.8%Other
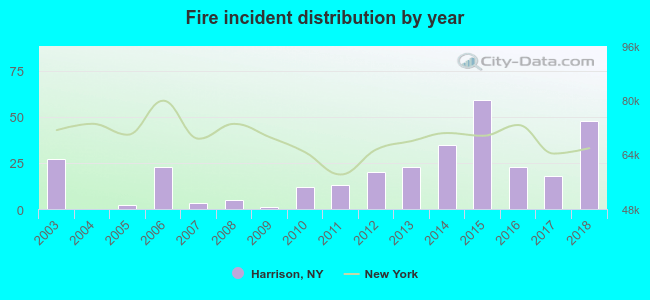 Based on the data from the years 2003 - 2018 the average number of fire incidents per year is 20. The highest number of fire incidents - 59 took place in 2015, and the least - 0 in 2004. The data has a rising trend.
The average number of yearly fire incidents per 10k residents in Harrison, NY compared to nearest cities:
(Note: Based on data for the last 3 years, including only cities with population 5,000 and above)
| Harrison: | 10.5 |
| Rye Brook: | 19.9 |
| White Plains: | 29.4 |
| Port Chester: | 7.6 |
| Rye: | 23.8 |
| Scarsdale: | 26.9 |
| Hartsdale: | 102.7 |
| Eastchester: | 27.6 |
| Larchmont: | 22.9 |
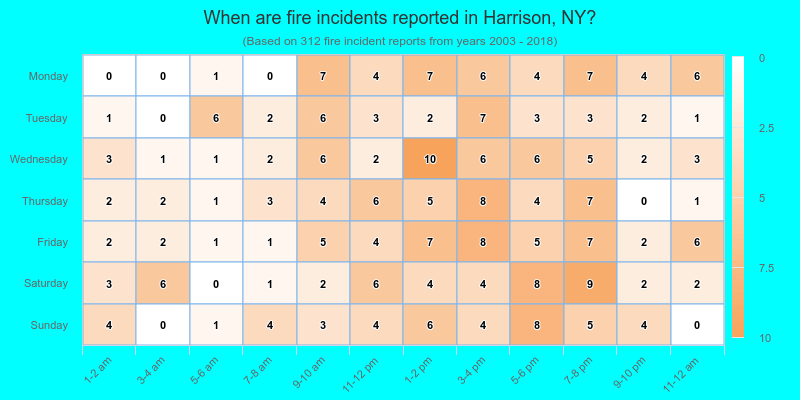
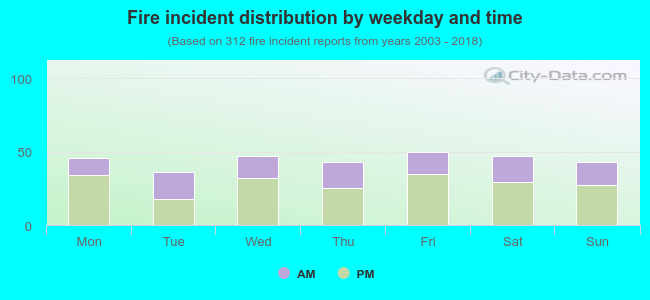 35.9% incidents where reported in the morning and 64.1% in the evening. The most fires (16.0%) took place on Friday, and the least (11.5%) on Tuesday.
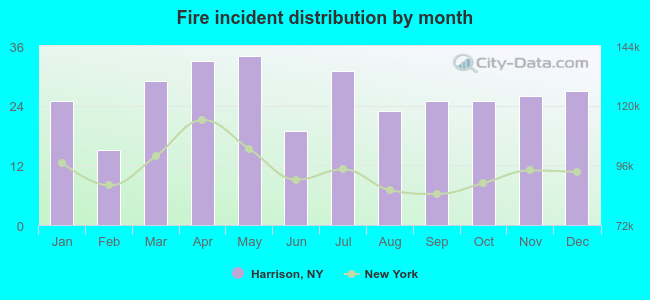 According to the 312 incident reports from years 2003 - 2018 most fires (10.9%) took place during May, and the least (4.8%) in February.
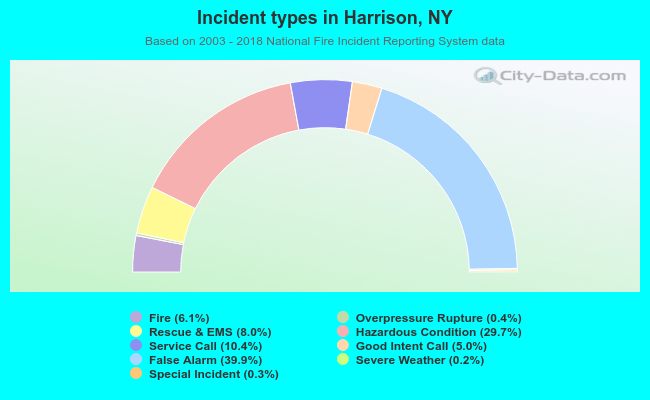 Out of all 5,109 cases reported during the years 2003 - 2018, the most belonged to the categories: False Alarm (39.9%), Hazardous Condition (29.7%), and Service Call (10.4%).
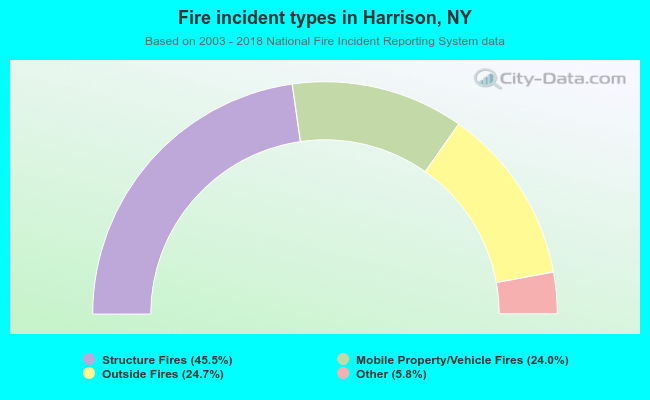 When looking into fire subcategories, the most reports belonged to: Structure Fires (45.5%), and Outside Fires (24.7%).