Haubstadt: Fire Incidents, Indiana (IN)
Where are fire incidents reported in Haubstadt, IN
Something went wrong! Please refresh the page.
|
| |||||||||||||||||||||||||||||||||||||||||||||||||||||||||||||||||||||||||||||||||||||||||||||||||||||||||||||
2002 - 2018 National Fire Incident Reporting System (NFIRS) incidents
- Incident types reported to NFIRS in Haubstadt, IN
- 75756.9%Rescue & EMS
- 25819.4%Fire
- 14210.7%Hazardous Condition
- 997.4%Good Intent Call
- 443.3%Service Call
- 272.0%False Alarm
- 30.2%Special Incident
- Fire incident types reported to NFIRS in Haubstadt, IN
- 10239.5%Outside Fires
- 6926.7%Mobile Property/Vehicle Fires
- 6625.6%Structure Fires
- 218.1%Other
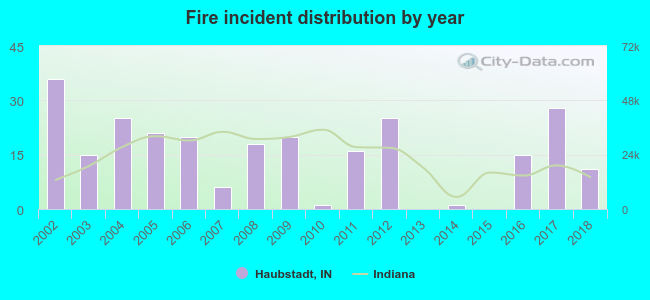 Based on the data from the years 2002 - 2018 the average number of fire incidents per year is 15. The highest number of reported fires - 36 took place in 2002, and the least - 0 in 2013. The data has a decreasing trend.
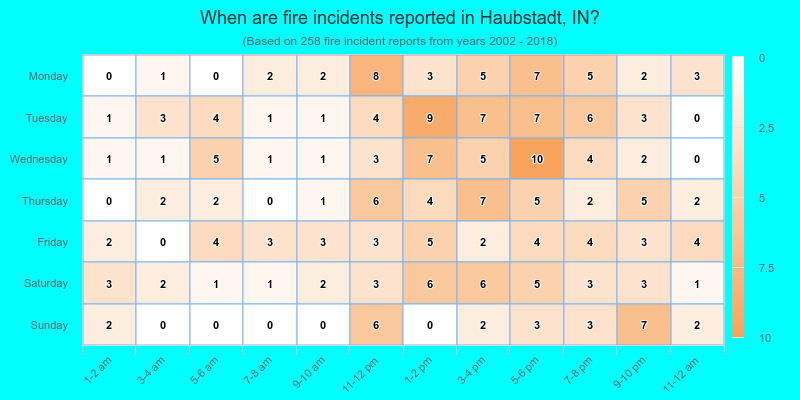
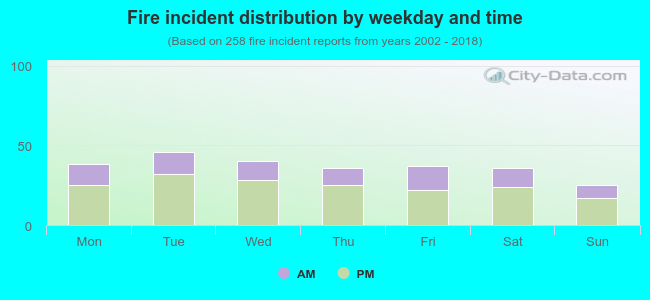 32.9% incidents where reported in the morning and 67.1% in the evening. The most fires (17.8%) took place on Tuesday, and the least (9.7%) on Sunday.
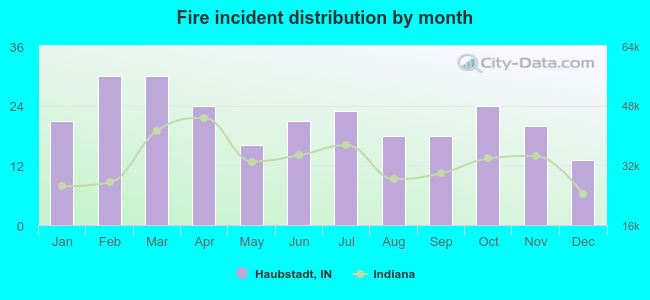 According to the 258 fire incident reports from years 2002 - 2018 most fires (11.6%) took place during February, and the least (5.0%) in December.
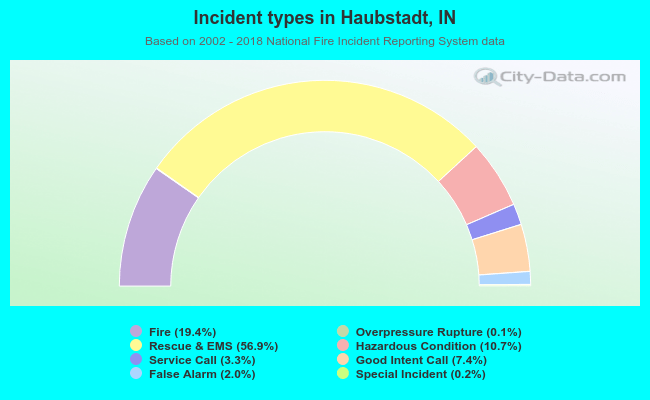 Out of all 1,331 cases reported during the years 2002 - 2018, the most belonged to the categories: Rescue & EMS (56.9%), Fire (19.4%), and Hazardous Condition (10.7%).
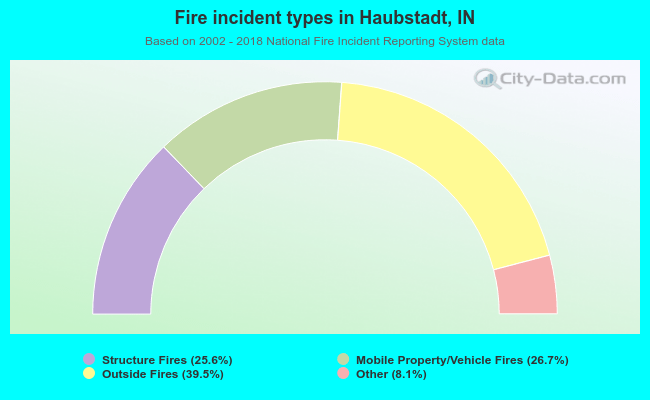 When looking into fire subcategories, the most reports belonged to: Outside Fires (39.5%), and Mobile Property/Vehicle Fires (26.7%).