| Fire incidents reported |
|---|
| Sreet name | Count |
|---|
| AKONI PULE HWY | 112 | | HAWI RD | 42 | | HOEA RD | 28 | | KOHALA MOUNTAIN RD | 12 | | AKONI PULE HWY | 10 | | KAAUHUHU RD | 10 | | HWY 270 | 8 | | KAPAA PARK RD | 8 | | BEERS RD | 6 | | KAMAKANA CIR | 6 | | KEAWE IKI ST | 6 | | KOKOIKI RD | 6 | | HAWI RD | 4 | | HONOMAKAU RD | 4 | | HUALUA RD | 4 | | ILINA RD | 4 | | KAAUHUHU HOMESTEAD RD | 4 | | KAHEI RD | 4 | | KYNNERSLEY RD | 4 | | MAHUKONA PARK RD | 4 | | OLD COAST GUARD RD | 4 | | SMITH RD | 4 | | UNION MILL RD | 4 | | 270 HWY | 2 | | AKONI PULE HW | 2 |
| | | Fire incidents reported |
|---|
| Sreet name | Count |
|---|
| AKONI PULE HWY, 14MM | 2 | | ALAALAE RD | 2 | | HALAULA HILL | 2 | | HONOMAKA'U RD | 2 | | HOOK RD | 2 | | HWY 270 APPROX. 15MM | 2 | | IKI RD | 2 | | ILINA RD | 2 | | KAAUHUHU HMSTD RD | 2 | | KAHEI RD. | 2 | | KAMA LOOP . | 2 | | KAMAKANI LOOP | 2 | | KAPAA STATE PARK RD | 2 | | KEAWE IKI PL | 2 | | KEAWE IKI RD | 2 | | KOHALA MOUNTAIN RD | 2 | | KOHALA MT. RD | 2 | | KOHALA RANCH RD | 2 | | KUUPUALANI PL | 2 | | LINCOLN RD | 2 | | PRATT RD. | 2 | | PUAKEA BAY RD | 2 | | PUU MAMO | 2 | | PUU MAMO DR | 2 | | |
|
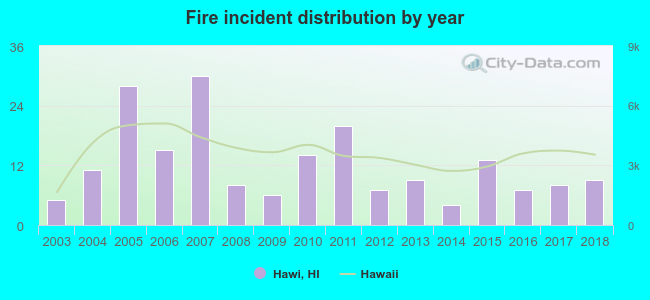 According to the data from the years 2003 - 2018 the average number of fires per year is 12. The highest number of reported fires - 30 took place in 2007, and the least - 4 in 2014. The data has a growing trend.
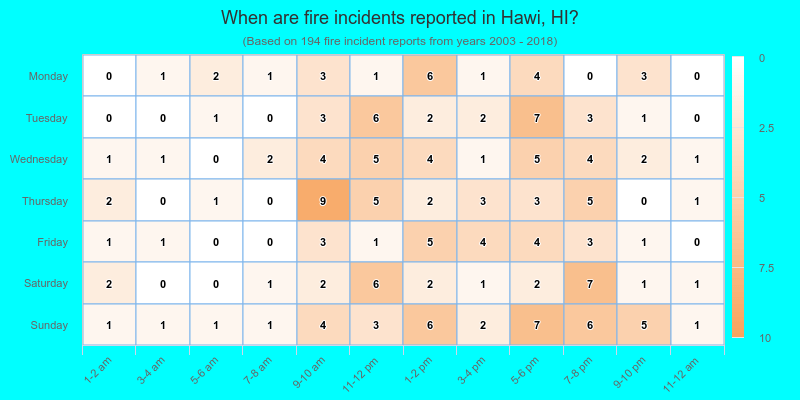
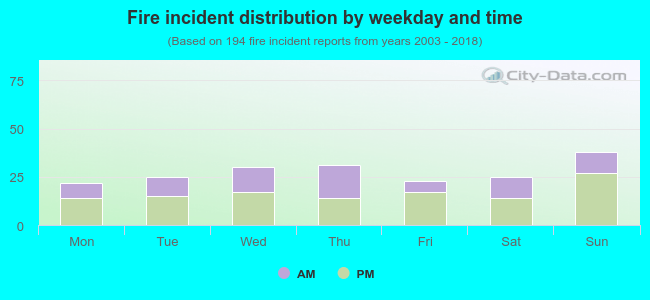 39.2% incidents where reported in the morning and 60.8% in the evening. The most fires (19.6%) took place on Sunday, and the least (11.3%) on Monday.
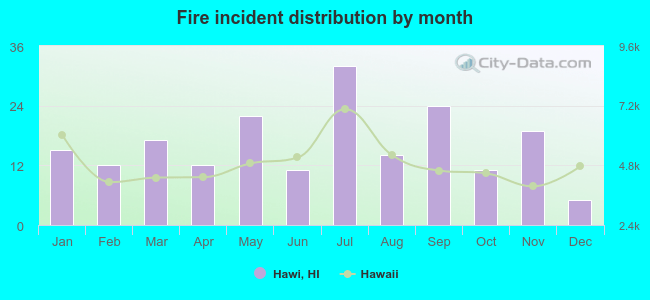 Based on the 194 fire incident reports from years 2003 - 2018 most fires (16.5%) took place during July, and the least (2.6%) in December.
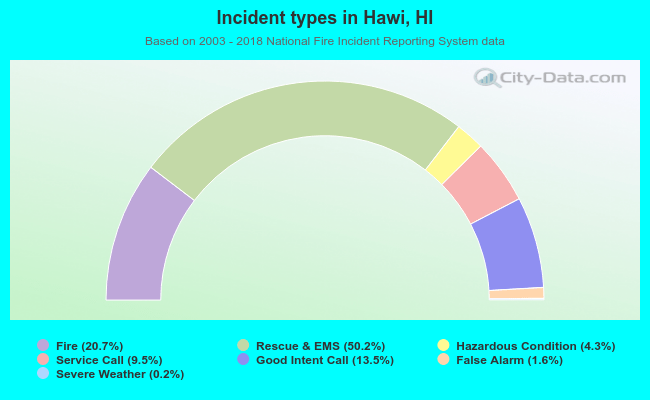 Out of all 936 cases reported during the years 2003 - 2018, the most belonged to the categories: Overpressure Rupture (50.2%), Fire (20.7%), and Service Call (13.5%).
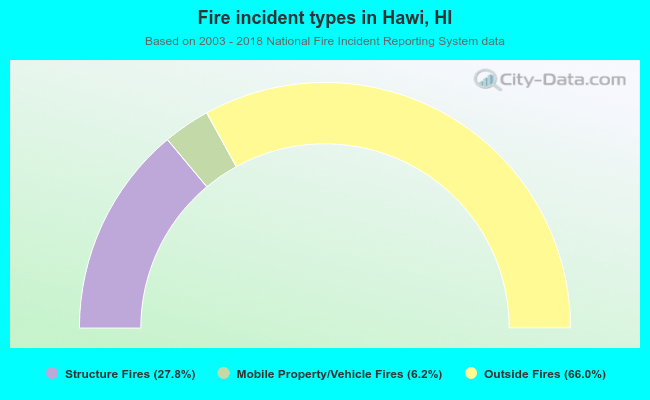 When looking into fire subcategories, the most incidents belonged to: Outside Fires (66.0%), and Structure Fires (27.8%).