Heber: Fire Incidents, California (CA)
Where are fire incidents reported in Heber, CA
Something went wrong! Please refresh the page.
|
| |||||||||||||||||||||||||||||||||||||||||||||||||||||||||||||||||||||||||||||||||||||||||||||||||||||||||||||
2005 - 2018 National Fire Incident Reporting System (NFIRS) incidents
- Incident types reported to NFIRS in Heber, CA
- 1,04156.6%Rescue & EMS
- 35519.3%Fire
- 1578.5%Service Call
- 1498.1%Good Intent Call
- 784.2%Hazardous Condition
- 553.0%False Alarm
- 30.2%Special Incident
- Fire incident types reported to NFIRS in Heber, CA
- 23365.6%Outside Fires
- 6117.2%Mobile Property/Vehicle Fires
- 3610.1%Structure Fires
- 257.0%Other
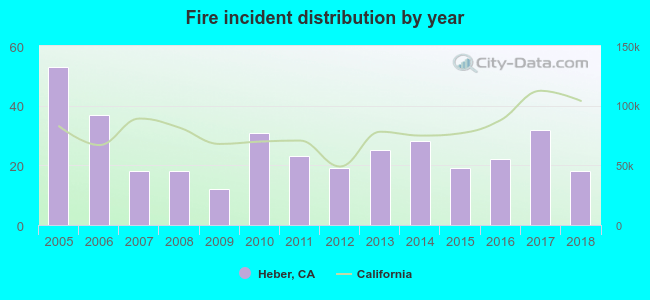 According to the data from the years 2005 - 2018 the average number of fire incidents per year is 25. The highest number of fires - 53 took place in 2005, and the least - 12 in 2009. The data has a decreasing trend.
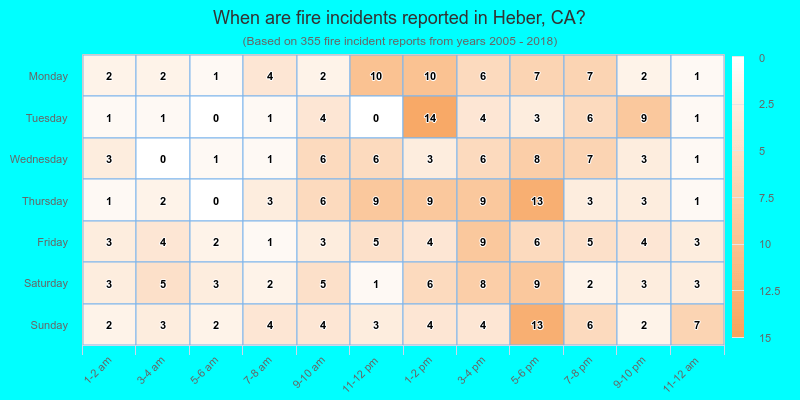
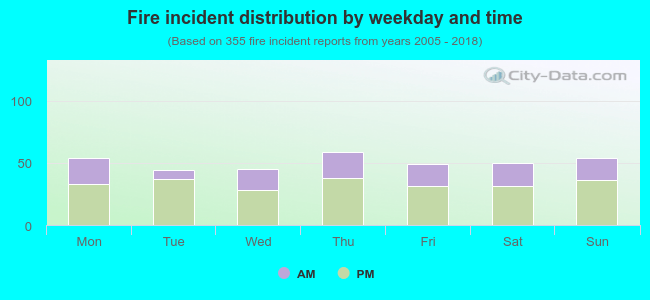 34.1% incidents where reported in the morning and 65.9% in the evening. The most fires (16.6%) took place on Thursday, and the least (12.4%) on Tuesday.
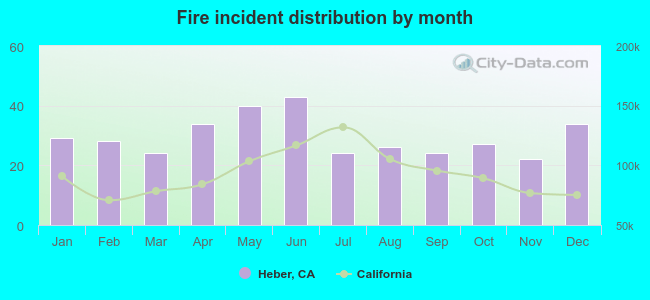 According to the 355 fire incident reports from years 2005 - 2018 most fires (12.1%) took place during June, and the least (6.2%) in November.
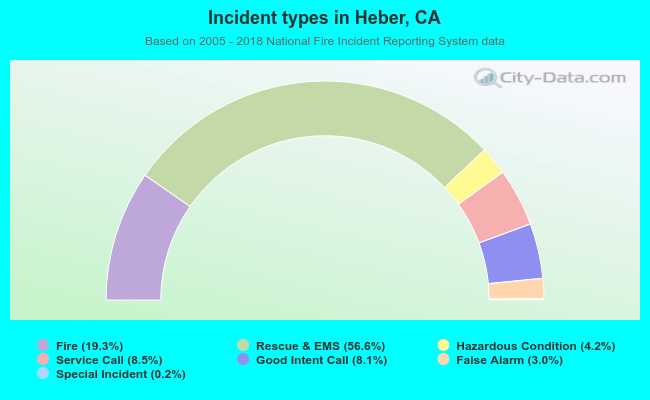 Out of all 1,838 cases reported during the years 2005 - 2018, the most belonged to the categories: Overpressure Rupture (56.6%), Fire (19.3%), and Hazardous Condition (8.5%).
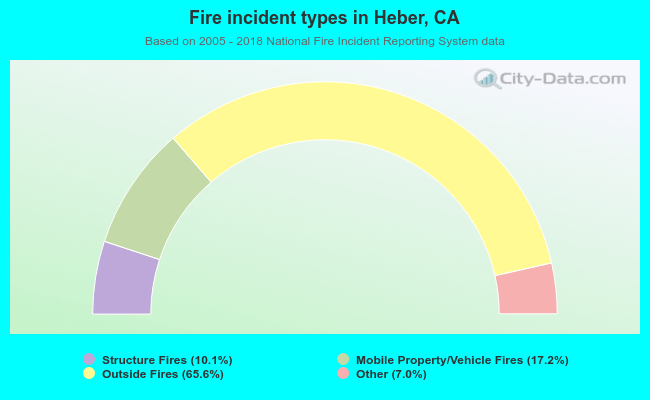 When looking into fire subcategories, the most incidents belonged to: Outside Fires (65.6%), and Mobile Property/Vehicle Fires (17.2%).