Hephzibah: Fire Incidents, Georgia (GA)
Where are fire incidents reported in Hephzibah, GA
Something went wrong! Please refresh the page.
| Fire incidents reported | |
|---|---|
| Sreet name | Count |
| WINDSOR SPRING RD | 232 |
| DEANS BRIDGE RD | 158 |
| OLD WAYNESBORO RD | 98 |
| HEPHZIBAH MCBEAN RD | 96 |
| TOBACCO RD | 90 |
| FULCHER RD | 76 |
| STORY MILL RD | 76 |
| BROWN RD | 74 |
| MIMS RD | 72 |
| PEACH ORCHARD RD | 66 |
| WILLIS FOREMAN RD | 62 |
| KARLEEN RD | 60 |
| PATILLER RD | 60 |
| FARMERS BRIDGE RD | 52 |
| HEPHZIBAH-MCBEAN RD | 50 |
| PATTERSON BRIDGE RD | 50 |
| CROSSCREEK RD | 44 |
| HEPHZIBAHMCBEAN RD | 42 |
| MORGAN RD | 42 |
| FAIRINGTON DR | 40 |
| SPIRIT CREEK RD | 40 |
| JAMES DR | 36 |
| BOYKIN RD | 34 |
| MCCOMBS RD | 34 |
| ALGERNON CIR | 32 |
| BATH PATTERSON RD | 32 |
| CREST DR | 32 |
| MIKE PADGETT HWY | 32 |
| SEAGO RD | 30 |
| TRAVIS RD | 30 |
| Other | 525 |
2002 - 2018 National Fire Incident Reporting System (NFIRS) incidents
- Incident types reported to NFIRS in Hephzibah, GA
- 4,30841.9%Rescue & EMS
- 2,39723.3%Fire
- 1,18411.5%Good Intent Call
- 8448.2%False Alarm
- 6636.5%Service Call
- 6446.3%Hazardous Condition
- 2072.0%Special Incident
- 210.2%Overpressure Rupture
- Fire incident types reported to NFIRS in Hephzibah, GA
- 1,34556.1%Outside Fires
- 73530.7%Structure Fires
- 29112.1%Mobile Property/Vehicle Fires
- 261.1%Other
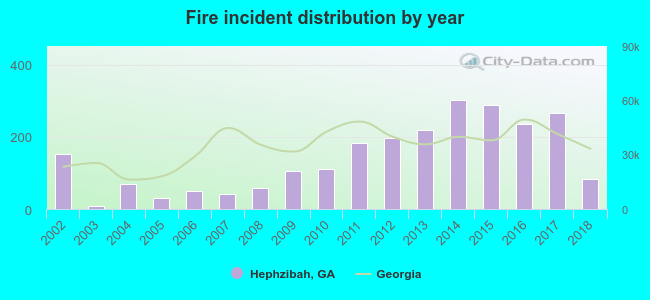 Based on the data from the years 2002 - 2018 the average number of fires per year is 141. The highest number of fires - 301 took place in 2014, and the least - 8 in 2003. The data has a declining trend.
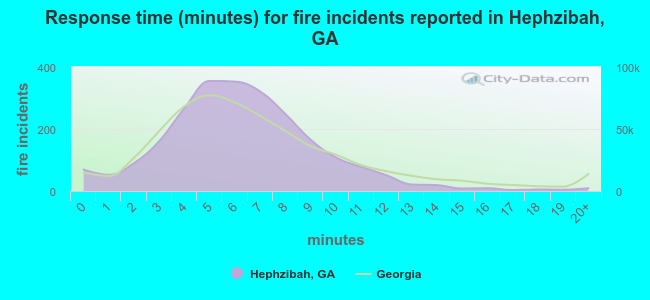 The median response time based on all reported fire incidents is 6 minutes. This is comparable to the Georgia median value.
The median response time in Hephzibah, GA compared to nearest cities:
(Note: Based on data for all years, including only cities with at least 500 fire incidents)
| Hephzibah: | 6 minutes |
| Grovetown: | 5 minutes |
| Augusta: | 5 minutes |
| Evans: | 5 minutes |
| Martinez: | 5 minutes |
| Waynesboro: | 4 minutes |
| Wrens: | 5 minutes |
| Appling: | 6 minutes |
| Thomson: | 6 minutes |
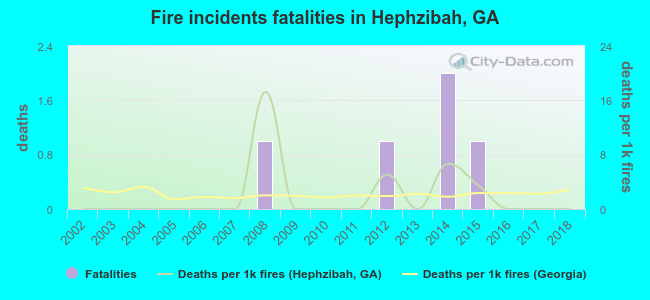 Based on the data from the years 2002 - 2018 the average number of fire-related fatalities per year is 0. The highest number of reported deaths - 2 took place in 2014, and the lowest - 0 in 2002. The data has a constant trend.
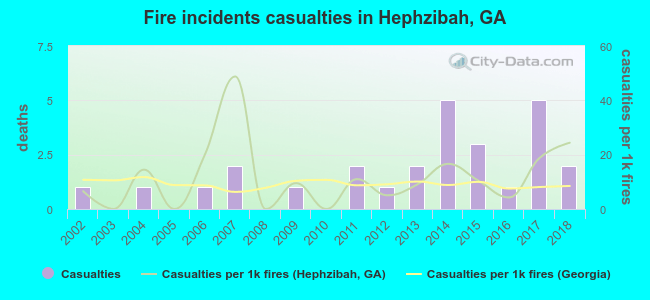 Based on the reports from the years 2002 - 2018 the average number of fire-related casualties per year is 2. The highest number of injuries - 5 took place in 2014, and the lowest - 0 in 2003. The data has an increasing trend.
The average number of injuries per 1,000 fire incidents is 12. This indicator was the highest - 49 in 2007, and the lowest 0 in 2003. The trend for injuries per 1,000 incidents is growing. Compared to the state value the number of injuries per 1,000 fire incidents is higher.
Based on the reports from the years 2002 - 2018 the average number of fire-related casualties per year is 2. The highest number of injuries - 5 took place in 2014, and the lowest - 0 in 2003. The data has an increasing trend.
The average number of injuries per 1,000 fire incidents is 12. This indicator was the highest - 49 in 2007, and the lowest 0 in 2003. The trend for injuries per 1,000 incidents is growing. Compared to the state value the number of injuries per 1,000 fire incidents is higher.
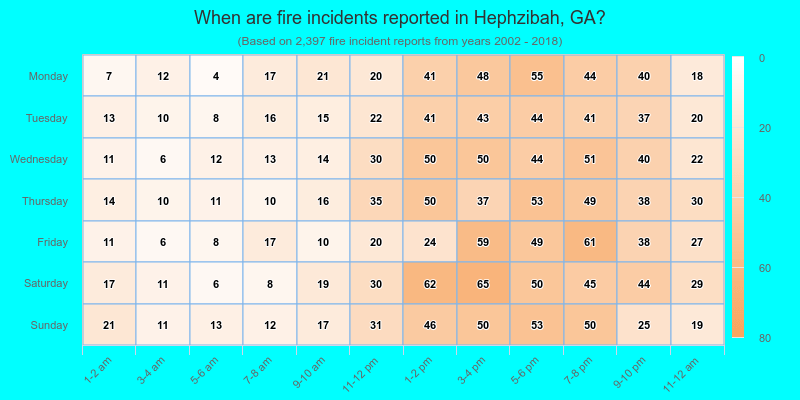
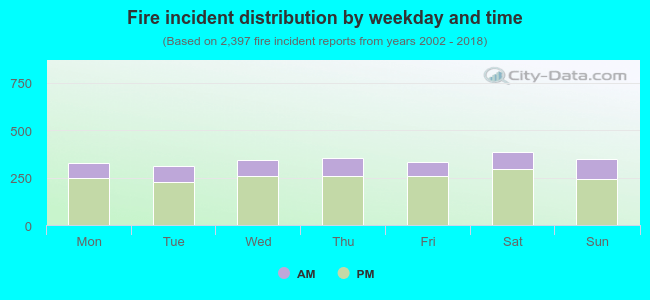 25.7% incidents where reported in the morning and 74.3% in the evening. The most fires (16.1%) took place on Saturday, and the least (12.9%) on Tuesday.
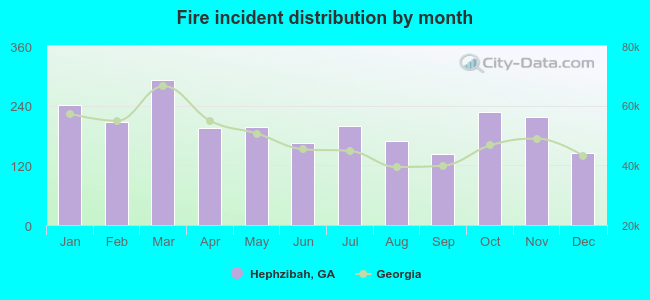 According to the 2,397 fire incidents from years 2002 - 2018 most fires (12.1%) took place during March, and the least (6.0%) in September.
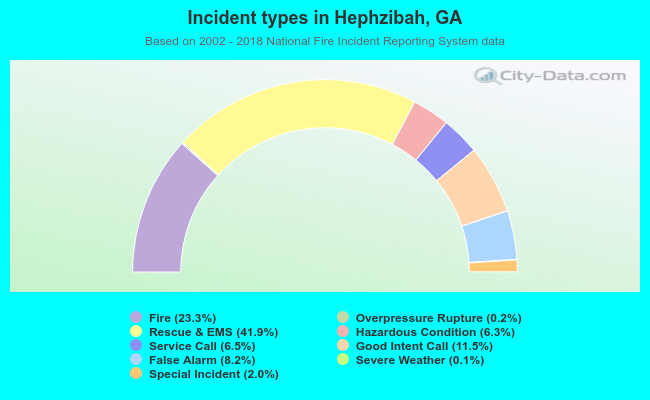 Out of all 10,274 cases reported during the years 2002 - 2018, the most belonged to the categories: Rescue & EMS (41.9%), Fire (23.3%), and Good Intent Call (11.5%).
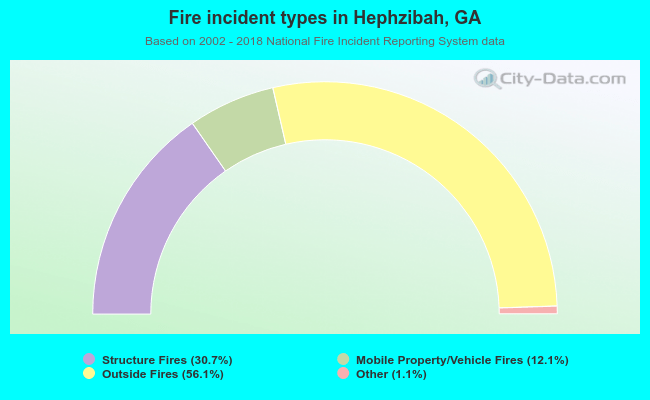 When looking into fire subcategories, the most incidents belonged to: Outside Fires (56.1%), and Structure Fires (30.7%).