Hot Springs: Fire Incidents, Arkansas (AR)
Where are fire incidents reported in Hot Springs, AR
Something went wrong! Please refresh the page.
| Fire incidents reported | |
|---|---|
| Sreet name | Count |
| CENTRAL | 254 |
| CENTRAL AVE | 218 |
| AIRPORT RD | 172 |
| CENTRAL AV | 172 |
| ALBERT PIKE RD | 160 |
| MALVERN | 114 |
| PARK AVE | 114 |
| MALVERN AVE | 110 |
| SPRING ST | 96 |
| ALBERT PIKE | 86 |
| GRAND | 86 |
| GRAND AV | 86 |
| MOORE RD | 66 |
| DR MARTIN LUTHER KING JR EXPY | 64 |
| LAKESHORE DR | 60 |
| GRAND AVE | 58 |
| HIGDON FERRY RD | 56 |
| AIRPORT | 48 |
| AMITY RD | 48 |
| CARPENTER DAM RD | 48 |
| PARK | 48 |
| HWY 290 | 44 |
| MOUNTAIN PINE RD | 44 |
| MALVERN AV | 42 |
| SUMMER ST | 42 |
| HIGHWAY 290 | 40 |
| MALVERN AV | 40 |
| CONES RD | 38 |
| MARION ANDERSON RD | 36 |
| SPRING | 36 |
| Other | 5,335 |
2002 - 2018 National Fire Incident Reporting System (NFIRS) incidents
- Incident types reported to NFIRS in Hot Springs, AR
- 7,86126.4%Fire
- 7,28724.5%Rescue & EMS
- 4,32414.5%Service Call
- 3,64812.3%False Alarm
- 3,61412.1%Hazardous Condition
- 2,8859.7%Good Intent Call
- 750.3%Overpressure Rupture
- 450.2%Severe Weather
- 400.1%Special Incident
- Fire incident types reported to NFIRS in Hot Springs, AR
- 3,50844.6%Outside Fires
- 2,96737.7%Structure Fires
- 1,16514.8%Mobile Property/Vehicle Fires
- 2212.8%Other
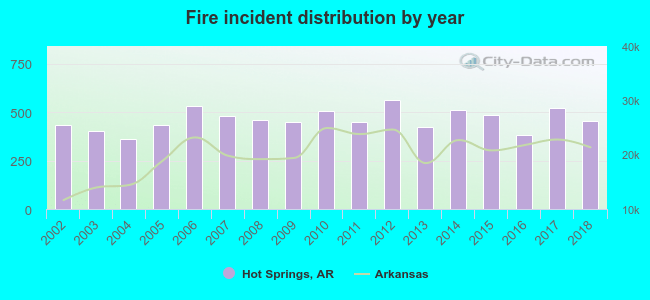 According to the data from the years 2002 - 2018 the average number of fires per year is 462. The highest number of fire incidents - 562 took place in 2012, and the least - 364 in 2004. The data has a rising trend.
The average number of yearly fire incidents per 10k residents in Hot Springs, AR compared to nearest cities:
(Note: Based on data for the last 3 years, including only cities with population 5,000 and above)
| Hot Springs: | 127.3 |
| Hot Springs Village: | 27.8 |
| Malvern: | 210.6 |
| Arkadelphia: | 80.4 |
| Benton: | 96.6 |
| Bryant: | 54.2 |
| East End: | 1.4 |
| Maumelle: | 23.6 |
| Little Rock: | 80.1 |
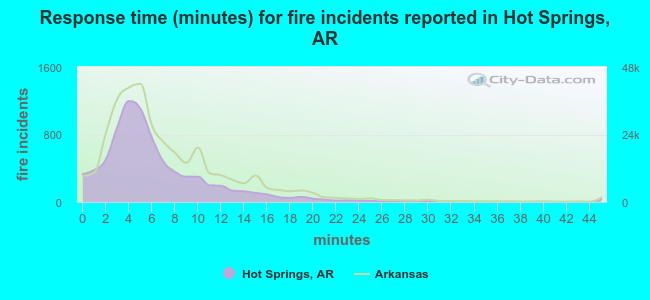 The median response time based on all reported fire incidents is 5 minutes. This is lower compared to the state median value.
The median response time in Hot Springs, AR compared to nearest cities:
(Note: Based on data for all years, including only cities with at least 500 fire incidents)
| Hot Springs: | 5 minutes |
| Malvern: | 6 minutes |
| Arkadelphia: | 5 minutes |
| Benton: | 6 minutes |
| Bauxite: | 10 minutes |
| Bryant: | 5 minutes |
| Alexander: | 9 minutes |
| Perryville: | 8 minutes |
| Sheridan: | 10 minutes |
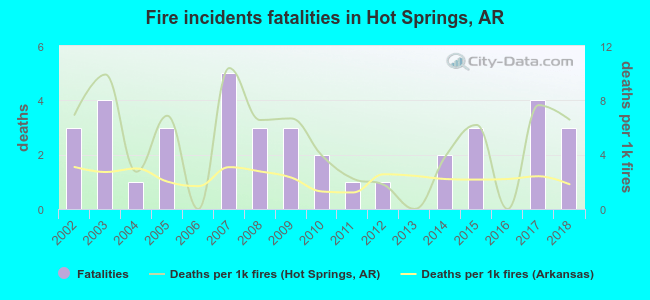 According to the data from the years 2002 - 2018 the average number of fire-related fatalities per year is 2. The highest number of reported deaths - 5 took place in 2007, and the lowest - 0 in 2006. The data has a constant trend.
The average number of deaths per 1,000 fires is 5. This indicator was the highest - 10 in 2007, and the lowest 0 in 2006. The trend for fatalities per 1,000 incidents is declining. Compared to the state value the number of fatalities per 1,000 incidents is much higher.
According to the data from the years 2002 - 2018 the average number of fire-related fatalities per year is 2. The highest number of reported deaths - 5 took place in 2007, and the lowest - 0 in 2006. The data has a constant trend.
The average number of deaths per 1,000 fires is 5. This indicator was the highest - 10 in 2007, and the lowest 0 in 2006. The trend for fatalities per 1,000 incidents is declining. Compared to the state value the number of fatalities per 1,000 incidents is much higher.Deaths per 1,000 incidents in Hot Springs, AR compared to nearest cities:
(Note: Based on data for all years, including only cities with at least 2,500 fire incidents)
| Hot Springs: | 4.8 |
| Malvern: | 5.0 |
| Benton: | 1.2 |
| Little Rock: | 1.4 |
| North Little Rock: | 2.3 |
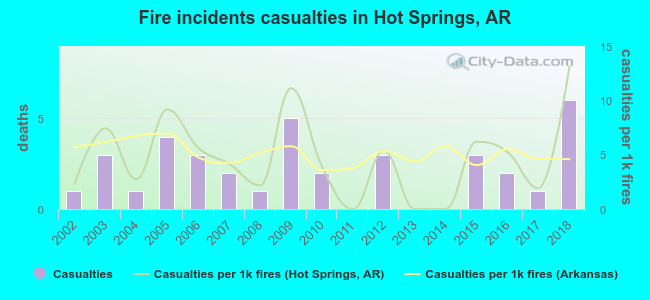 Based on the reports from the years 2002 - 2018 the average number of fire-related yearly casualties is 2. The highest number of reported injuries - 6 took place in 2018, and the lowest - 0 in 2011. The data has an increasing trend.
The average number of casualties per 1,000 fire incidents is 5. This indicator was the highest - 13 in 2018, and the lowest 0 in 2011. The trend for injuries per 1,000 fires is rising. Compared to the Arkansas value the number of casualties per 1,000 fires is similar.
Based on the reports from the years 2002 - 2018 the average number of fire-related yearly casualties is 2. The highest number of reported injuries - 6 took place in 2018, and the lowest - 0 in 2011. The data has an increasing trend.
The average number of casualties per 1,000 fire incidents is 5. This indicator was the highest - 13 in 2018, and the lowest 0 in 2011. The trend for injuries per 1,000 fires is rising. Compared to the Arkansas value the number of casualties per 1,000 fires is similar.Casualties per 1,000 incidents in Hot Springs, AR compared to nearest cities:
(Note: Based on data for all years, including only cities with at least 500 fire incidents)
| Hot Springs: | 4.7 |
| Malvern: | 5.0 |
| Arkadelphia: | 0.0 |
| Benton: | 0.8 |
| Bauxite: | 0.0 |
| Bryant: | 3.5 |
| Alexander: | 3.5 |
| Perryville: | 0.0 |
| Sheridan: | 2.2 |
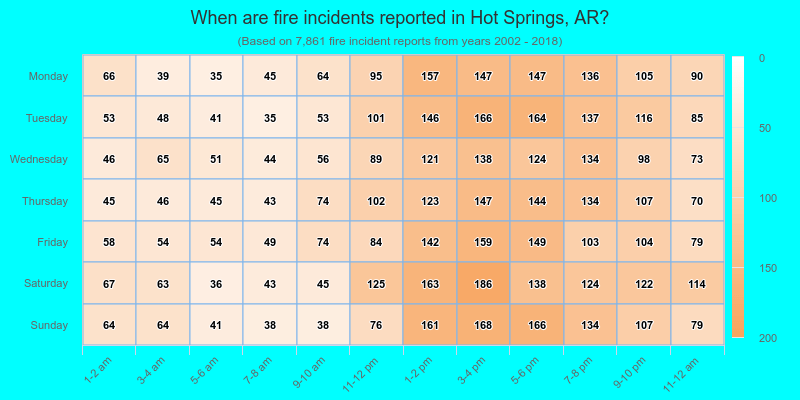
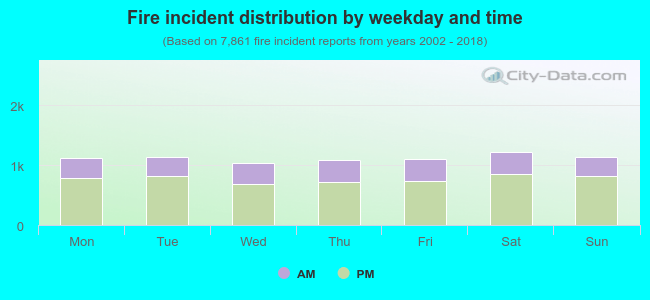 31.2% incidents where reported in the morning and 68.8% in the evening. The most fires (15.6%) took place on Saturday, and the least (13.2%) on Wednesday.
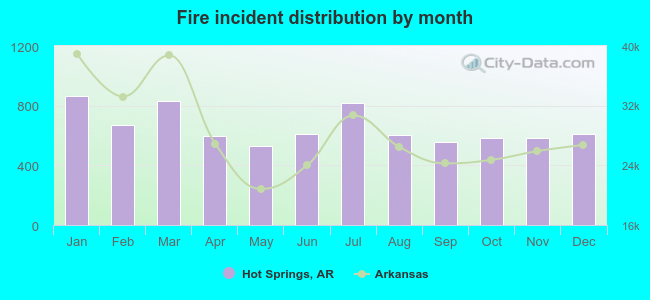 Based on the 7,861 reports from years 2002 - 2018 most fires (11.0%) took place during January, and the least (6.8%) in May.
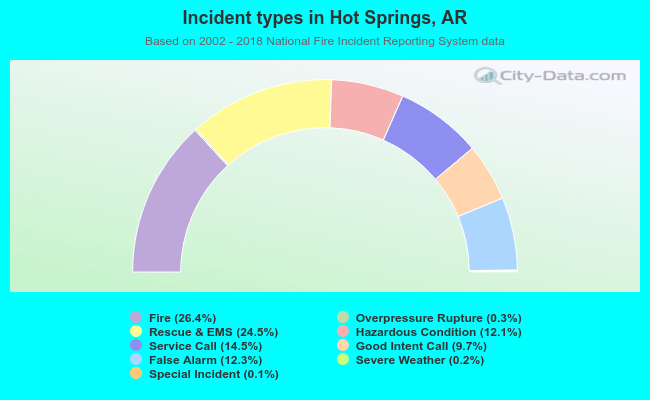 Out of all 29,779 cases reported during the years 2002 - 2018, the most belonged to the categories: Fire (26.4%), Rescue & EMS (24.5%), and Service Call (14.5%).
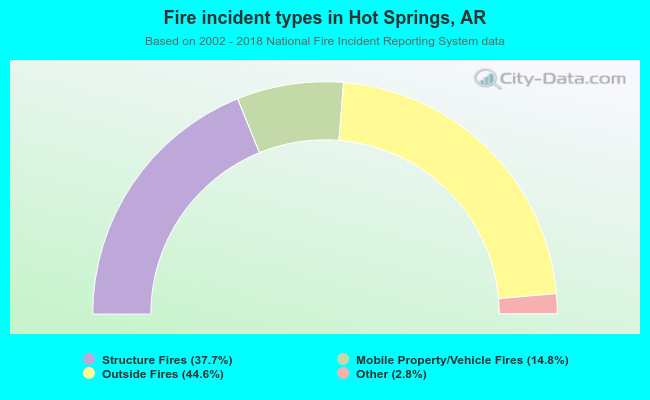 When looking into fire subcategories, the most reports belonged to: Outside Fires (44.6%), and Structure Fires (37.7%).