Hudson: Fire Incidents, Massachusetts (MA)
Where are fire incidents reported in Hudson, MA
Something went wrong! Please refresh the page.
| Fire incidents reported | |
|---|---|
| Sreet name | Count |
| WASHINGTON ST | 182 |
| MAIN ST | 124 |
| CENTRAL ST | 78 |
| MANNING ST | 46 |
| BRENT DR | 38 |
| COX ST | 34 |
| RIVER RD | 34 |
| SOUTH ST | 30 |
| TECHNOLOGY DR | 30 |
| BRIGHAM ST | 28 |
| BROAD ST | 28 |
| COTTAGE ST | 26 |
| FOREST AVE | 26 |
| HIGHLAND COMMONS | 26 |
| LAKE ST | 22 |
| LINCOLN ST | 22 |
| RIVER ST | 22 |
| CHURCH ST | 20 |
| WARNER ST | 20 |
| APSLEY ST | 18 |
| FELTON ST | 16 |
| HIGH ST | 16 |
| LAKESHORE DR | 16 |
| MARLBORO ST | 16 |
| PARK ST | 16 |
| TOWER ST | 16 |
| GLEN RD | 14 |
| SCHOOL ST | 14 |
| BENNETT ST | 12 |
| BRIGHAM CIR | 12 |
2002 - 2018 National Fire Incident Reporting System (NFIRS) incidents
- Incident types reported to NFIRS in Hudson, MA
- 6,47339.0%Rescue & EMS
- 3,86023.3%Hazardous Condition
- 1,67510.1%Service Call
- 1,5499.3%False Alarm
- 1,4648.8%Special Incident
- 9475.7%Fire
- 5783.5%Good Intent Call
- Fire incident types reported to NFIRS in Hudson, MA
- 38941.1%Structure Fires
- 35037.0%Outside Fires
- 15716.6%Mobile Property/Vehicle Fires
- 515.4%Other
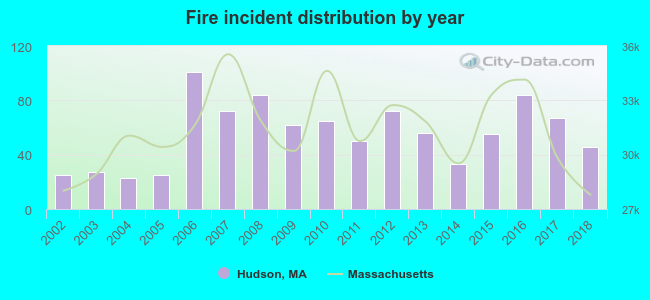 Based on the data from the years 2002 - 2018 the average number of fires per year is 56. The highest number of fires - 101 took place in 2006, and the least - 23 in 2004. The data has an increasing trend.
The average number of yearly fire incidents per 10k residents in Hudson, MA compared to nearest cities:
(Note: Based on data for the last 3 years, including only cities with population 5,000 and above)
| Hudson: | 44.1 |
| Marlborough: | 31.4 |
| Stow: | 22.8 |
| Maynard: | 25.7 |
| Clinton: | 88.9 |
| Southborough: | 38.6 |
| Sudbury: | 15.3 |
| Northborough: | 77.8 |
| Lancaster: | 34.3 |
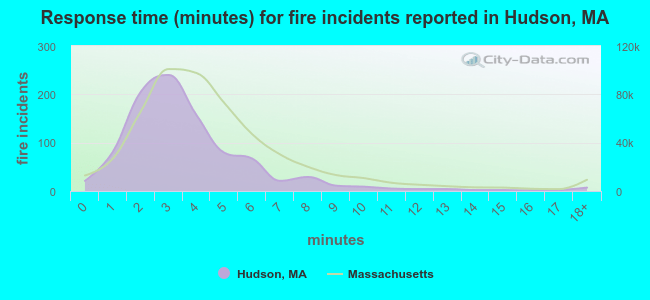 The median response time based on all reported fire incidents is 3 minutes. This is lower than the Massachusetts median value.
The median response time in Hudson, MA compared to nearest cities:
(Note: Based on data for all years, including only cities with at least 500 fire incidents)
| Hudson: | 3 minutes |
| Marlborough: | 5 minutes |
| Clinton: | 3 minutes |
| Southborough: | 6 minutes |
| Sudbury: | 4 minutes |
| Northborough: | 6 minutes |
| Acton: | 4 minutes |
| Harvard: | 9 minutes |
| Westborough: | 5 minutes |
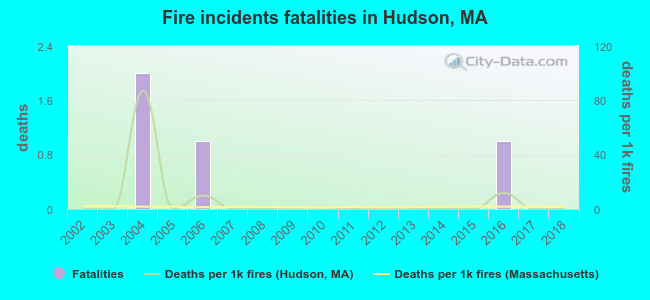 Based on the data from the years 2002 - 2018 the average number of fire-related fatalities per year is 0. The highest number of reported deaths - 2 took place in 2004, and the lowest - 0 in 2002. The data has a constant trend.
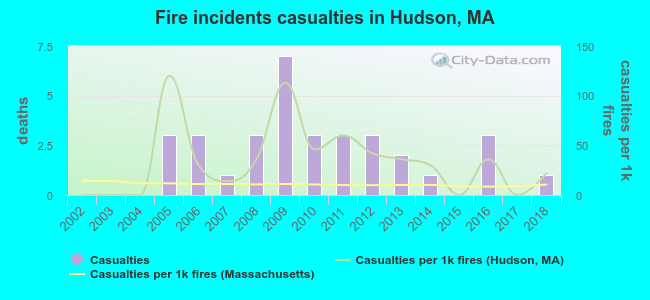 According to the data from the years 2002 - 2018 the average number of fire-related casualties per year is 2. The highest number of reported injuries - 7 took place in 2009, and the lowest - 0 in 2002. The data has an increasing trend.
The average number of injuries per 1,000 fire incidents is 34. This indicator was the highest - 120 in 2005, and the lowest 0 in 2002. The trend for injuries per 1,000 fires is growing. Compared to the state value the number of casualties per 1,000 fires is much higher.
According to the data from the years 2002 - 2018 the average number of fire-related casualties per year is 2. The highest number of reported injuries - 7 took place in 2009, and the lowest - 0 in 2002. The data has an increasing trend.
The average number of injuries per 1,000 fire incidents is 34. This indicator was the highest - 120 in 2005, and the lowest 0 in 2002. The trend for injuries per 1,000 fires is growing. Compared to the state value the number of casualties per 1,000 fires is much higher.Casualties per 1,000 incidents in Hudson, MA compared to nearest cities:
(Note: Based on data for all years, including only cities with at least 500 fire incidents)
| Hudson: | 34.8 |
| Marlborough: | 21.3 |
| Clinton: | 5.5 |
| Southborough: | 16.8 |
| Sudbury: | 8.6 |
| Northborough: | 18.2 |
| Acton: | 1.3 |
| Harvard: | 2.0 |
| Westborough: | 10.5 |
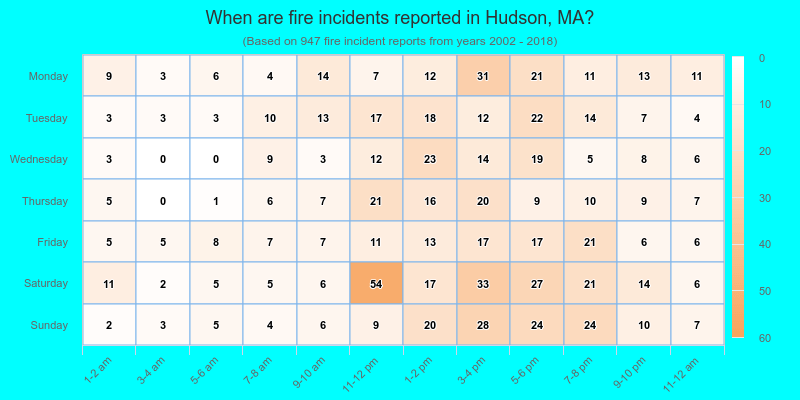
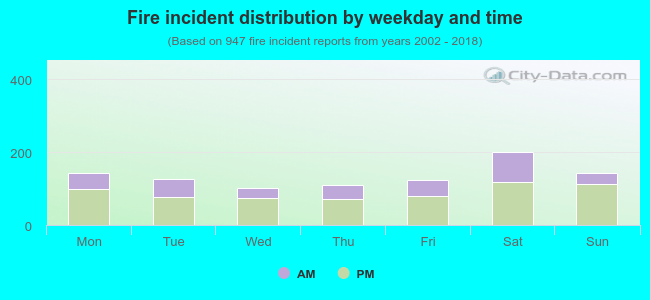 33.2% incidents where reported in the morning and 66.8% in the evening. The most fires (21.2%) took place on Saturday, and the least (10.8%) on Wednesday.
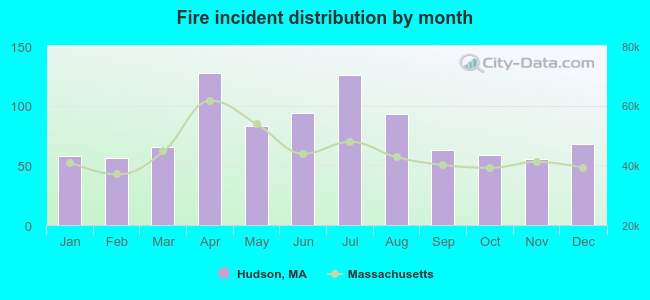 According to the 947 fires from years 2002 - 2018 most fires (13.4%) took place during April, and the least (5.8%) in November.
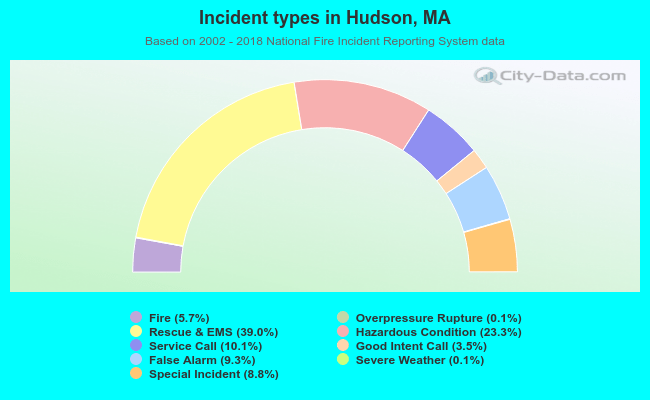 Out of all 16,577 cases reported during the years 2002 - 2018, the most belonged to the categories: Rescue & EMS (39.0%), Hazardous Condition (23.3%), and Service Call (10.1%).
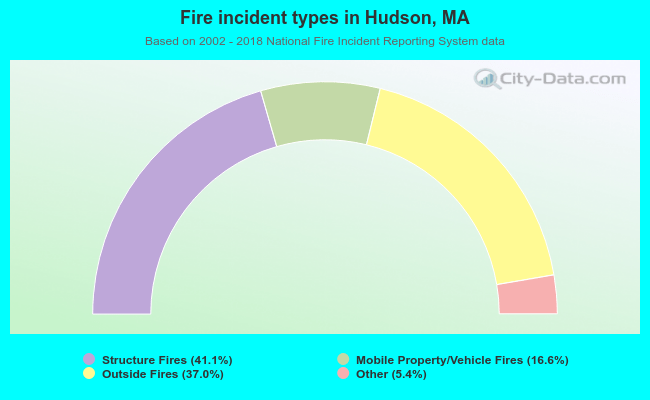 When looking into fire subcategories, the most reports belonged to: Structure Fires (41.1%), and Outside Fires (37.0%).