Huntertown: Fire Incidents, Indiana (IN)
Where are fire incidents reported in Huntertown, IN
Something went wrong! Please refresh the page.
|
| |||||||||||||||||||||||||||||||||||||||||||||||||||||||||||||||||||||||||||||||||||||||||||||||||||||||||||||
2002 - 2018 National Fire Incident Reporting System (NFIRS) incidents
- Incident types reported to NFIRS in Huntertown, IN
- 42642.8%Rescue & EMS
- 21621.7%Fire
- 18718.8%Hazardous Condition
- 787.8%Service Call
- 656.5%Good Intent Call
- 202.0%False Alarm
- 20.2%Severe Weather
- 10.1%Overpressure Rupture
- Fire incident types reported to NFIRS in Huntertown, IN
- 12256.5%Outside Fires
- 7032.4%Structure Fires
- 146.5%Mobile Property/Vehicle Fires
- 104.6%Other
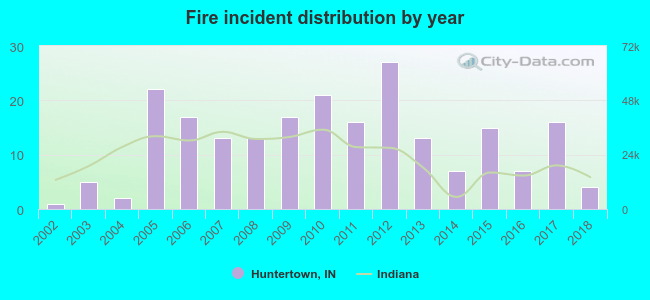 Based on the data from the years 2002 - 2018 the average number of fires per year is 13. The highest number of fire incidents - 27 took place in 2012, and the least - 1 in 2002. The data has an increasing trend.
The average number of yearly fire incidents per 10k residents in Huntertown, IN compared to nearest cities:
(Note: Based on data for the last 3 years, including only cities with population 5,000 and above)
| Huntertown: | 16.8 |
| Garrett: | 15.8 |
| Fort Wayne: | 23.1 |
| Auburn: | 11.4 |
| New Haven: | 20.8 |
| Kendallville: | 12.6 |
| Columbia City: | 56.6 |
| Huntington: | 30.9 |
| Angola: | 12.4 |
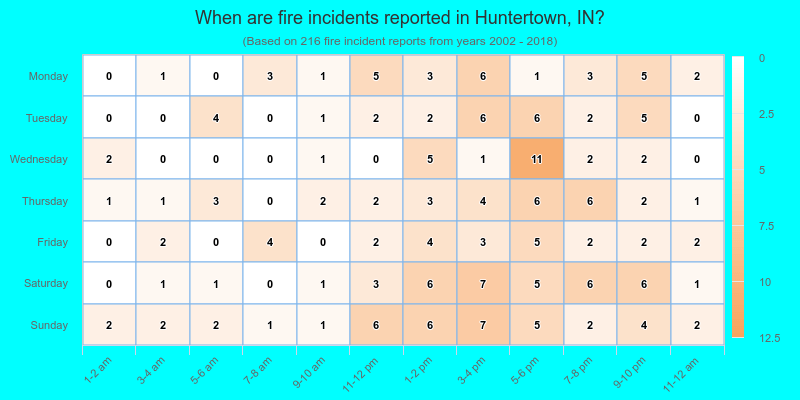
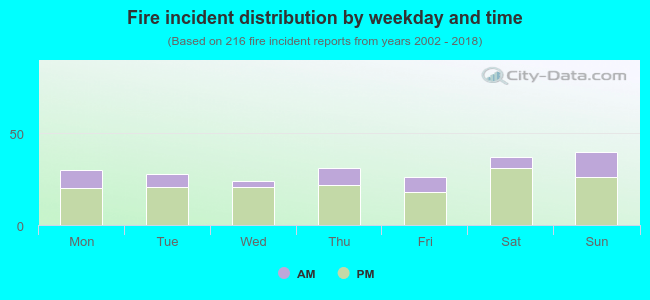 26.4% incidents where reported in the morning and 73.6% in the evening. The most fires (18.5%) took place on Sunday, and the least (11.1%) on Wednesday.
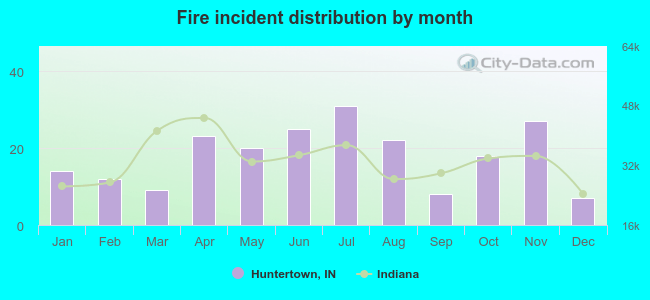 According to the 216 fires from years 2002 - 2018 most fires (14.4%) took place during July, and the least (3.2%) in December.
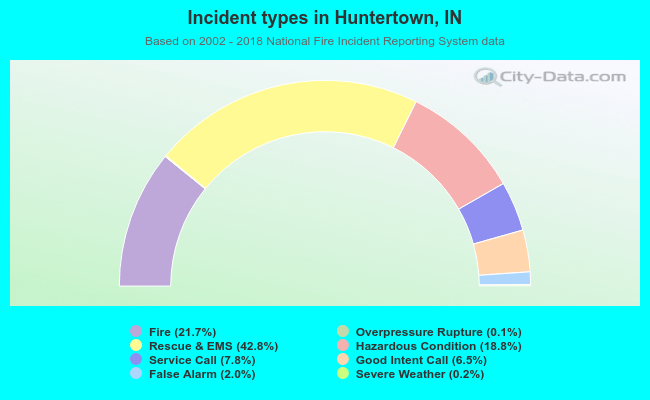 Out of all 995 cases reported during the years 2002 - 2018, the most belonged to the categories: Rescue & EMS (42.8%), Fire (21.7%), and Hazardous Condition (18.8%).
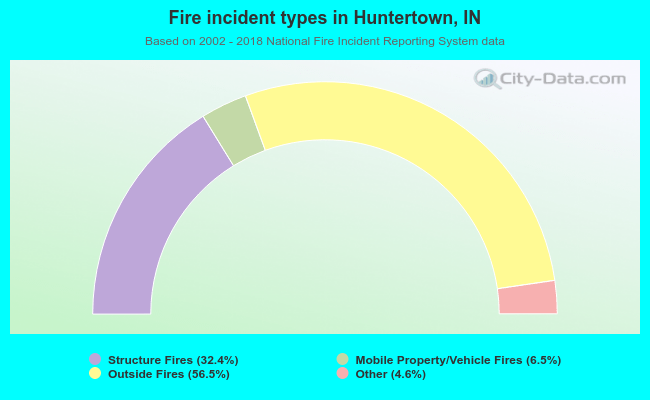 When looking into fire subcategories, the most reports belonged to: Outside Fires (56.5%), and Structure Fires (32.4%).