Hurst: Fire Incidents, Texas (TX)
Where are fire incidents reported in Hurst, TX
Something went wrong! Please refresh the page.
| Fire incidents reported | |
|---|---|
| Sreet name | Count |
| PIPELINE RD | 368 |
| PECAN ST | 232 |
| BELLAIRE DR | 182 |
| HURST BLVD | 182 |
| PRECINCT LINE RD | 174 |
| AIRPORT FRWY FWY | 162 |
| PLAZA BLVD | 120 |
| BROWN TRAIL | 118 |
| LOOP 820 HWY | 106 |
| SOTOGRANDE BLVD | 106 |
| BOOTH CALLOWAY RD | 100 |
| NORWOOD DR | 90 |
| HARWOOD RD | 88 |
| MELBOURNE RD | 84 |
| HURSTVIEW DR | 70 |
| GRAPEVINE HWY | 58 |
| WILLOW ST | 50 |
| BEDFORD-EULESS RD | 40 |
| ARCADIA ST | 38 |
| SYLVAN DR | 38 |
| CAVENDER DR | 34 |
| BROWN TRL | 32 |
| HARRISON LA | 32 |
| REDBUD DR | 30 |
| BEDFORDEULESS RD | 28 |
| NE LOOP 820 | 28 |
| SIMPSON DR | 28 |
| NORWOOD | 26 |
| AIRPORT FWY | 24 |
| ARWINE DR | 24 |
2003 - 2018 National Fire Incident Reporting System (NFIRS) incidents
- Incident types reported to NFIRS in Hurst, TX
- 15,23956.9%Rescue & EMS
- 3,20912.0%Service Call
- 2,81510.5%Hazardous Condition
- 2,3318.7%Fire
- 1,8066.7%Good Intent Call
- 1,2884.8%False Alarm
- 720.3%Special Incident
- 290.1%Overpressure Rupture
- Fire incident types reported to NFIRS in Hurst, TX
- 93340.0%Structure Fires
- 88638.0%Outside Fires
- 39617.0%Mobile Property/Vehicle Fires
- 1165.0%Other
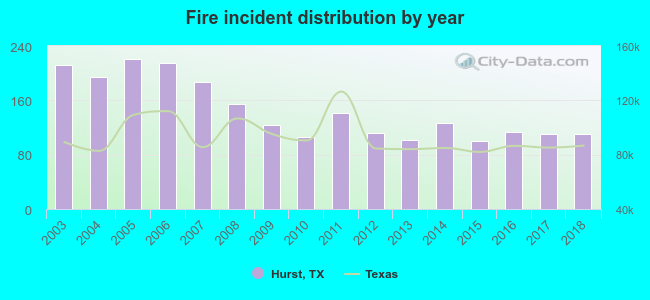 Based on the data from the years 2003 - 2018 the average number of fires per year is 146. The highest number of reported fire incidents - 221 took place in 2005, and the least - 100 in 2015. The data has a decreasing trend.
The average number of yearly fire incidents per 10k residents in Hurst, TX compared to nearest cities:
(Note: Based on data for the last 3 years, including only cities with population 5,000 and above)
| Hurst: | 28.8 |
| Bedford: | 29.2 |
| North Richland Hills: | 22.3 |
| Richland Hills: | 17.8 |
| Colleyville: | 22.2 |
| Watauga: | 29.2 |
| Euless: | 29.7 |
| Haltom City: | 42.3 |
| Keller: | 24.5 |
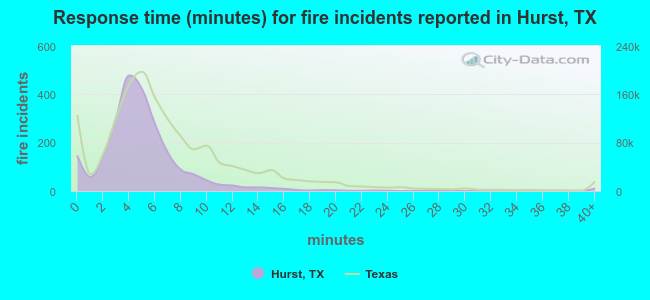 The median response time based on all reported fire incidents is 5 minutes. This is lower than the Texas median value.
The median response time in Hurst, TX compared to nearest cities:
(Note: Based on data for all years, including only cities with at least 500 fire incidents)
| Hurst: | 5 minutes |
| Bedford: | 4 minutes |
| North Richland Hills: | 6 minutes |
| Richland Hills: | 5 minutes |
| Colleyville: | 7 minutes |
| Watauga: | 6 minutes |
| Euless: | 5 minutes |
| Haltom City: | 5 minutes |
| Keller: | 6 minutes |
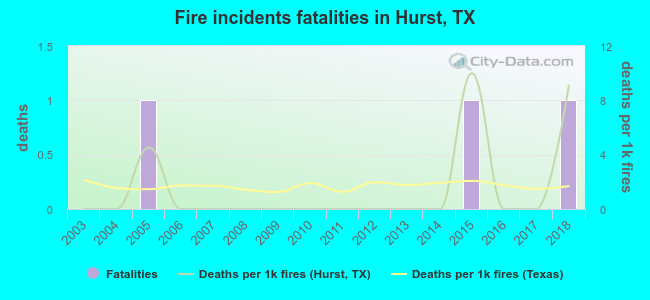 Based on the reports from the years 2003 - 2018 the average number of fire-related fatalities per year is 0. The highest number of reported deaths - 1 took place in 2005, and the lowest - 0 in 2003. The data has a rising trend.
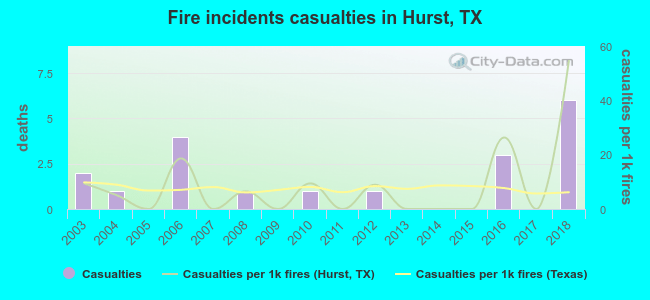 According to the reports from the years 2003 - 2018 the average number of fire-related casualties per year is 1. The highest number of casualties - 6 took place in 2018, and the lowest - 0 in 2005. The data has a growing trend.
The average number of casualties per 1,000 fire incidents is 9. This indicator was the highest - 55 in 2018, and the lowest 0 in 2005. The trend for casualties per 1,000 incidents is growing. Compared to the Texas value the number of injuries per 1,000 incidents is about the same.
According to the reports from the years 2003 - 2018 the average number of fire-related casualties per year is 1. The highest number of casualties - 6 took place in 2018, and the lowest - 0 in 2005. The data has a growing trend.
The average number of casualties per 1,000 fire incidents is 9. This indicator was the highest - 55 in 2018, and the lowest 0 in 2005. The trend for casualties per 1,000 incidents is growing. Compared to the Texas value the number of injuries per 1,000 incidents is about the same.Casualties per 1,000 incidents in Hurst, TX compared to nearest cities:
(Note: Based on data for all years, including only cities with at least 500 fire incidents)
| Hurst: | 8.2 |
| Bedford: | 30.9 |
| North Richland Hills: | 23.5 |
| Richland Hills: | 9.8 |
| Colleyville: | 2.2 |
| Watauga: | 3.6 |
| Euless: | 35.9 |
| Haltom City: | 6.0 |
| Keller: | 17.7 |
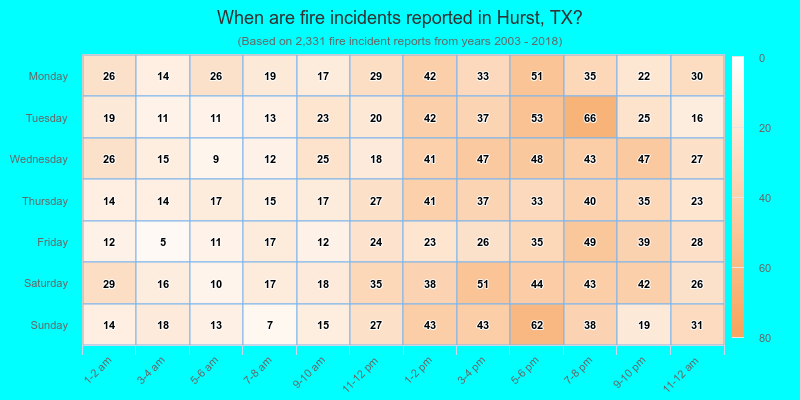
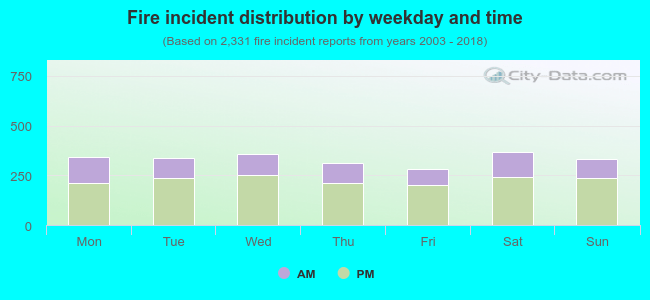 31.6% incidents where reported in the morning and 68.4% in the evening. The most fires (15.8%) took place on Saturday, and the least (12.1%) on Friday.
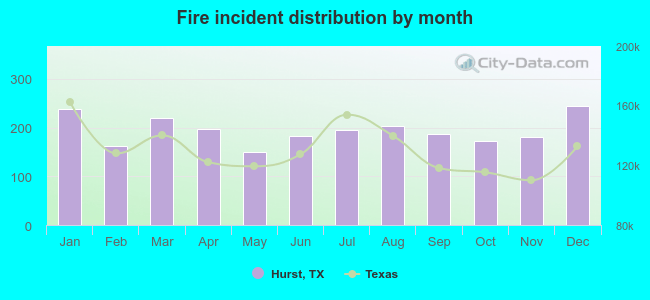 According to the 2,331 fire incident reports from years 2003 - 2018 most fires (10.5%) took place during December, and the least (6.4%) in May.
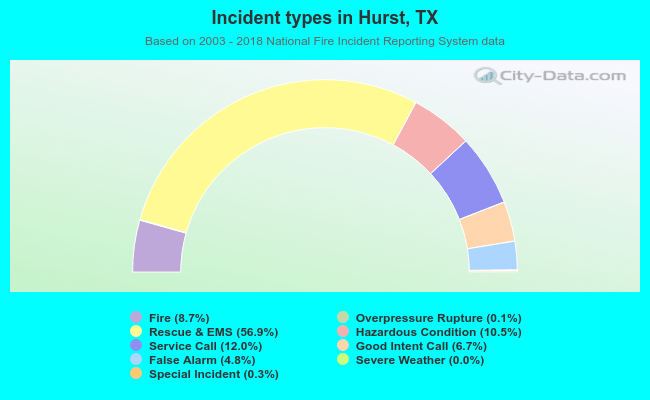 Out of all 26,799 cases reported during the years 2003 - 2018, the most belonged to the categories: Rescue & EMS (56.9%), Service Call (12.0%), and Hazardous Condition (10.5%).
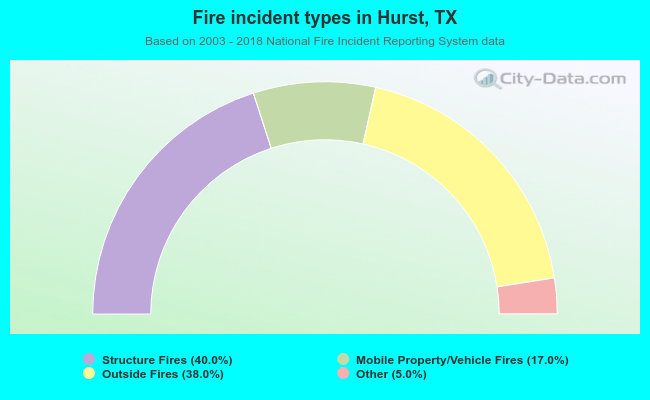 When looking into fire subcategories, the most reports belonged to: Structure Fires (40.0%), and Outside Fires (38.0%).