Imboden: Fire Incidents, Arkansas (AR)
Where are fire incidents reported in Imboden, AR
Something went wrong! Please refresh the page.
|
| |||||||||||||||||||||||||||||||||||||||||||||||||||||||||||||||||||||||||||||||||||||||||||||||||||||||||||||
| Other | 168 | |||||||||||||||||||||||||||||||||||||||||||||||||||||||||||||||||||||||||||||||||||||||||||||||||||||||||||||
2002 - 2018 National Fire Incident Reporting System (NFIRS) incidents
- Incident types reported to NFIRS in Imboden, AR
- 48648.4%Rescue & EMS
- 38838.6%Fire
- 545.4%Hazardous Condition
- 292.9%False Alarm
- 181.8%Service Call
- 151.5%Good Intent Call
- 70.7%Severe Weather
- 60.6%Special Incident
- Fire incident types reported to NFIRS in Imboden, AR
- 22056.7%Outside Fires
- 10827.8%Structure Fires
- 4411.3%Mobile Property/Vehicle Fires
- 164.1%Other
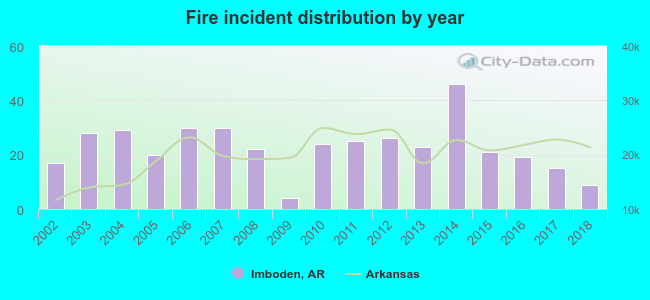 Based on the data from the years 2002 - 2018 the average number of fires per year is 23. The highest number of fire incidents - 46 took place in 2014, and the least - 4 in 2009. The data has a declining trend.
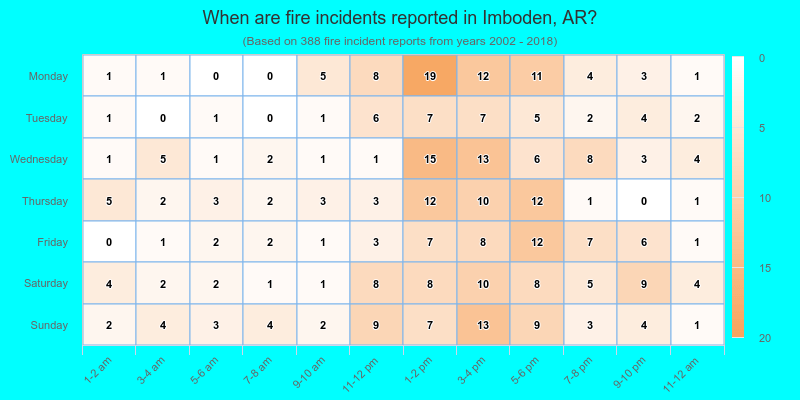
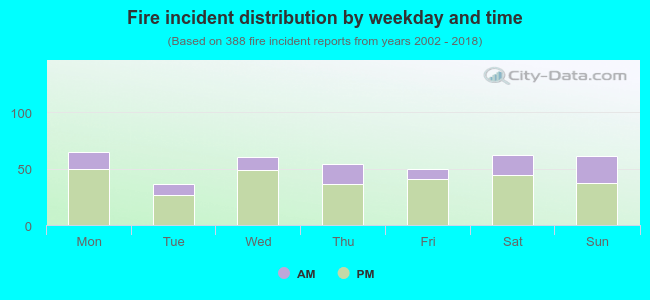 26.8% incidents where reported in the morning and 73.2% in the evening. The most fires (16.8%) took place on Monday, and the least (9.3%) on Tuesday.
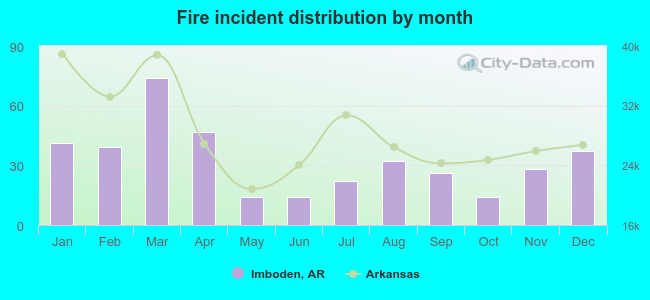 Based on the 388 fire incident reports from years 2002 - 2018 most fires (19.1%) took place during March, and the least (3.6%) in May.
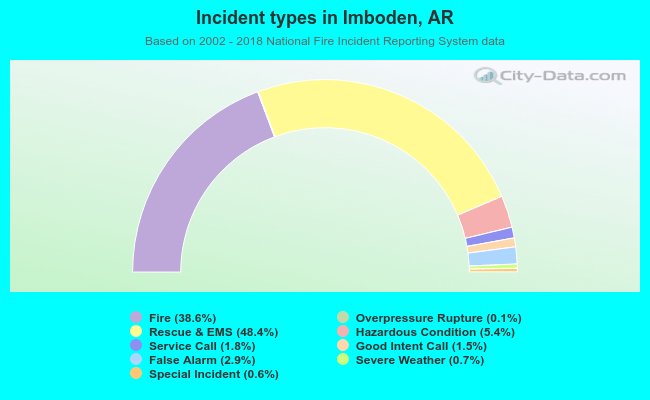 Out of all 1,004 cases reported during the years 2002 - 2018, the most belonged to the categories: Rescue & EMS (48.4%), Fire (38.6%), and Hazardous Condition (5.4%).
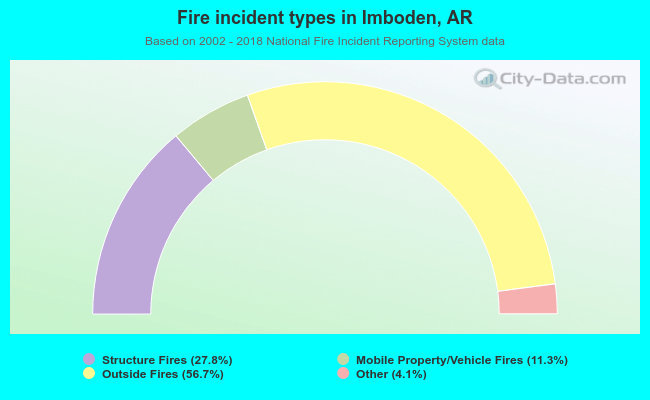 When looking into fire subcategories, the most incidents belonged to: Outside Fires (56.7%), and Structure Fires (27.8%).