Indiana: Fire Incidents, Pennsylvania (PA)
Where are fire incidents reported in Indiana, PA
Something went wrong! Please refresh the page.
|
| |||||||||||||||||||||||||||||||||||||||||||||||||||||||||||||||||||||||||||||||||||||||||||||||||||||||||||||
2004 - 2018 National Fire Incident Reporting System (NFIRS) incidents
- Incident types reported to NFIRS in Indiana, PA
- 36523.5%False Alarm
- 30919.9%Hazardous Condition
- 22214.3%Fire
- 21213.7%Rescue & EMS
- 20413.1%Good Intent Call
- 1509.7%Service Call
- 734.7%Severe Weather
- 161.0%Special Incident
- Fire incident types reported to NFIRS in Indiana, PA
- 13862.2%Structure Fires
- 4821.6%Outside Fires
- 2913.1%Mobile Property/Vehicle Fires
- 73.2%Other
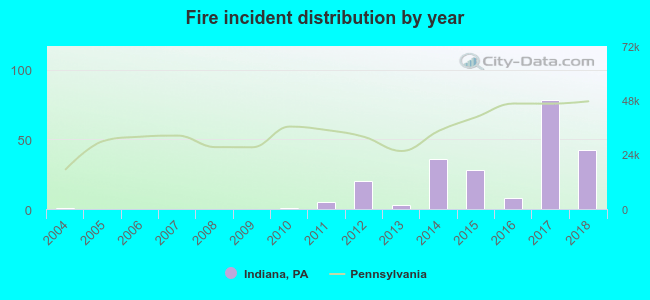 According to the data from the years 2004 - 2018 the average number of fire incidents per year is 15. The highest number of fires - 78 took place in 2017, and the least - 0 in 2005. The data has a growing trend.
The average number of yearly fire incidents per 10k residents in Indiana, PA compared to nearest cities:
(Note: Based on data for the last 3 years, including only cities with population 5,000 and above)
| Indiana: | 30.1 |
| Vandergrift: | 83.5 |
| Johnstown: | 79.3 |
| Latrobe: | 150.9 |
| Punxsutawney: | 79.8 |
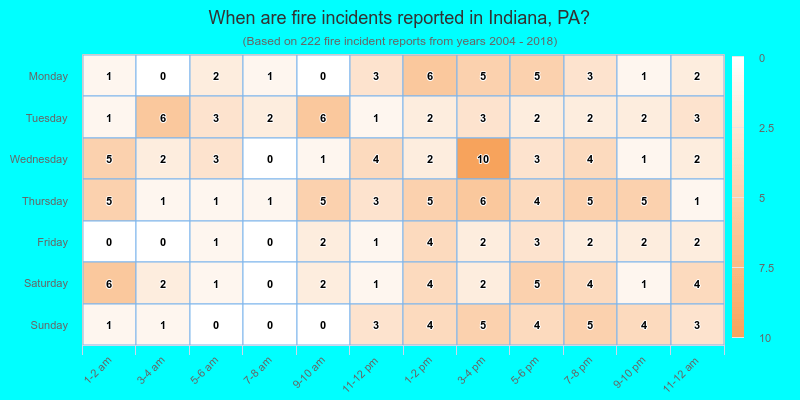
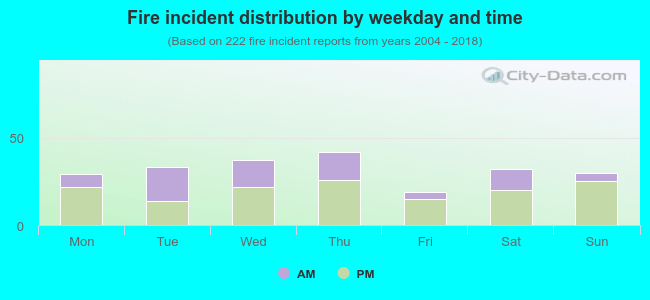 35.1% incidents where reported in the morning and 64.9% in the evening. The most fires (18.9%) took place on Thursday, and the least (8.6%) on Friday.
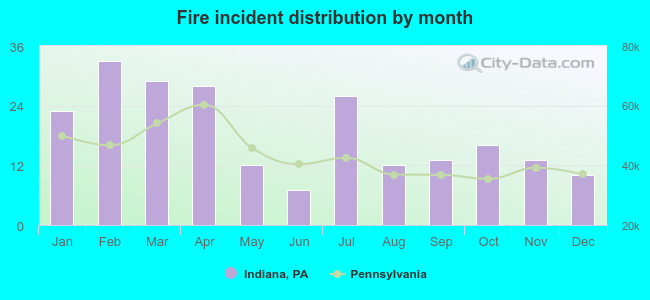 According to the 222 reports from years 2004 - 2018 most fires (14.9%) took place during February, and the least (3.2%) in June.
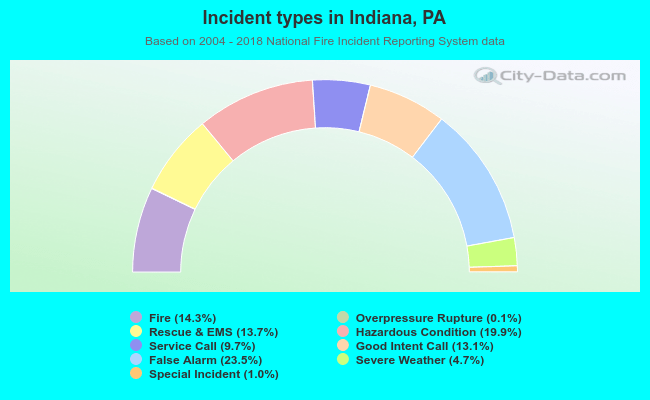 Out of all 1,552 cases reported during the years 2004 - 2018, the most belonged to the categories: False Alarm (23.5%), Hazardous Condition (19.9%), and Fire (14.3%).
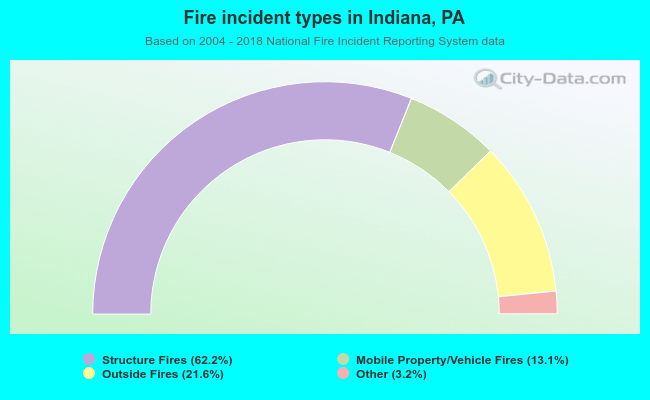 When looking into fire subcategories, the most incidents belonged to: Structure Fires (62.2%), and Outside Fires (21.6%).