| Fire incidents reported |
|---|
| Sreet name | Count |
|---|
| HWY 113 | 32 | | ST HWY 113 | 32 | | RIVER BOTTOM RD | 22 | | BALD MTN RD | 14 | | BLACKBERRY RD | 14 | | LONE OAK RD | 14 | | NALE LOOP | 12 | | NALE RD | 12 | | RAGAN RD | 12 | | LAKESHORE DR. | 10 | | RIVERBOTTOM RD | 10 | | SH113 | 10 | | YELLOWBULL RD | 10 | | 302 S 5TH STREET | 8 | | 4TH STREET | 8 | | 5TH STREET | 8 | | CHOATE PRAIRE RD | 8 | | CHOATE PRAIRIE RD | 8 | | MEDICINE CREEK RD | 8 | | SIMINOLE | 8 | | 2ND STREET | 6 | | ARAPAHO | 6 | | BALD MOUNTAIN RD | 6 | | CHINOOK | 6 | | FRY RD | 6 |
| | | Fire incidents reported |
|---|
| Sreet name | Count |
|---|
| HIGHWAY 113 | 6 | | HIWAY 113 | 6 | | KIOWA | 6 | | KIOWA RD | 6 | | KIOWA, CANADIAN SHORES | 6 | | N. LAKESHORE | 6 | | POTTAWATAMIA | 6 | | RIVER BOTTOM RD. | 6 | | SAWMILL RD | 6 | | SHOAT PRAIRIE RD | 6 | | 113 | 4 | | 113 HIGHWAY HWY | 4 | | 113 HWY | 4 | | 113 HWY | 4 | | 200 S DIVISION | 4 | | 265 WILDROSE RD | 4 | | BALD MT RD | 4 | | BALD MT ROAD | 4 | | BLACKBERRY | 4 | | BLACKBERRY RD | 4 | | E.LAKESHORE(CAN.SHORES) | 4 | | HIGHWAY 113 HWY | 4 | | HWY 113 SOUTH | 4 | | INDIAN NATION TURNPIKE | 4 | | |
|
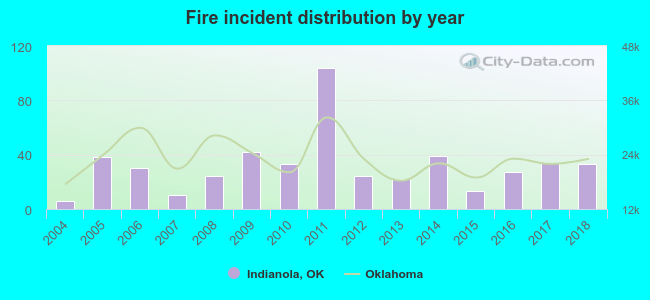 Based on the data from the years 2004 - 2018 the average number of fires per year is 32. The highest number of fire incidents - 104 took place in 2011, and the least - 6 in 2004. The data has a rising trend.
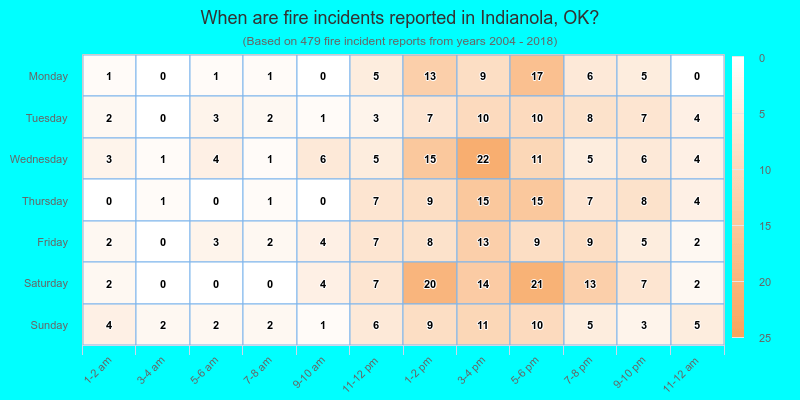
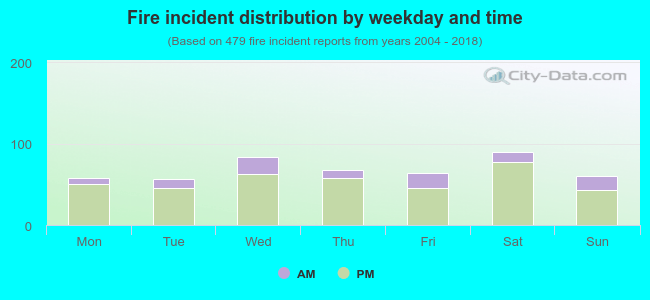 20.0% incidents where reported in the morning and 80.0% in the evening. The most fires (18.8%) took place on Saturday, and the least (11.9%) on Tuesday.
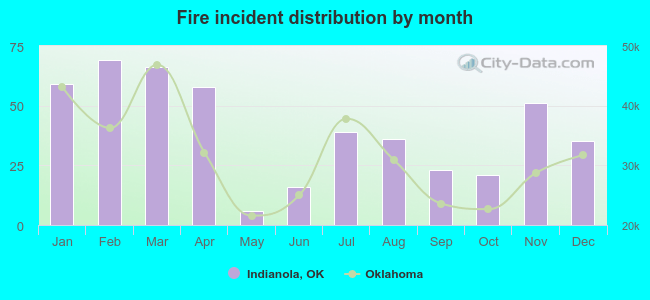 According to the 479 fires from years 2004 - 2018 most fires (14.4%) took place during February, and the least (1.3%) in May.
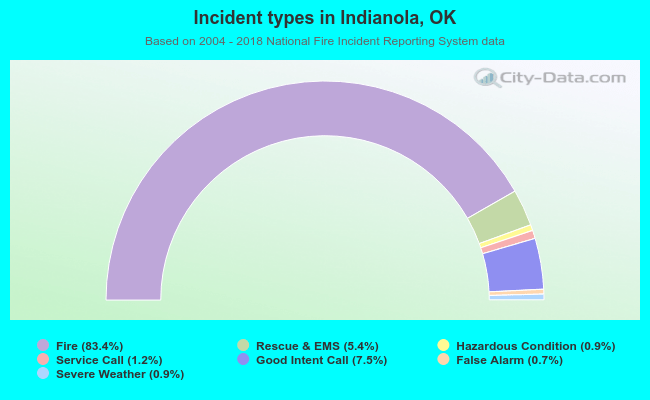 Out of all 574 cases reported during the years 2004 - 2018, the most belonged to the categories: Fire (83.4%), Service Call (7.5%), and Overpressure Rupture (5.4%).
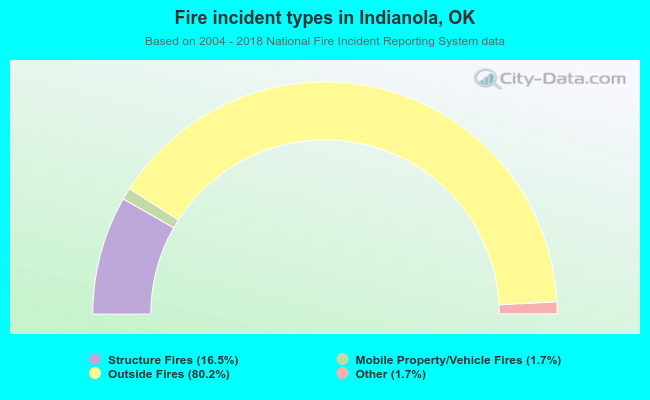 When looking into fire subcategories, the most incidents belonged to: Outside Fires (80.2%), and Structure Fires (16.5%).