Indio: Fire Incidents, California (CA)
Where are fire incidents reported in Indio, CA
Something went wrong! Please refresh the page.
|
| |||||||||||||||||||||||||||||||||||||||||||||||||||||||||||||||||||||||||||||||||||||||||||||||||||||||||||||
2006 - 2018 National Fire Incident Reporting System (NFIRS) incidents
- Incident types reported to NFIRS in Indio, CA
- 14347.7%Rescue & EMS
- 12441.3%Fire
- 144.7%Service Call
- 82.7%False Alarm
- 72.3%Hazardous Condition
- 41.3%Good Intent Call
- Fire incident types reported to NFIRS in Indio, CA
- 4637.1%Outside Fires
- 4233.9%Structure Fires
- 2822.6%Mobile Property/Vehicle Fires
- 86.5%Other
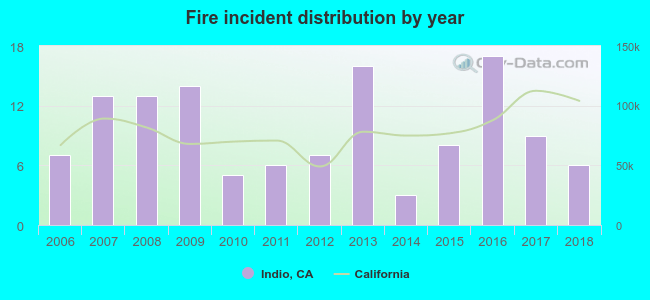 According to the data from the years 2006 - 2018 the average number of fires per year is 10. The highest number of fires - 17 took place in 2016, and the least - 3 in 2014. The data has a declining trend.
The average number of yearly fire incidents per 10k residents in Indio, CA compared to nearest cities:
(Note: Based on data for the last 3 years, including only cities with population 5,000 and above)
| Indio: | 1.2 |
| Bermuda Dunes: | 1.4 |
| Coachella: | 0.6 |
| La Quinta: | 0.8 |
| Indian Wells: | 1.9 |
| Palm Desert: | 0.6 |
| Rancho Mirage: | 1.1 |
| Mecca: | 3.5 |
| Cathedral City: | 30.9 |
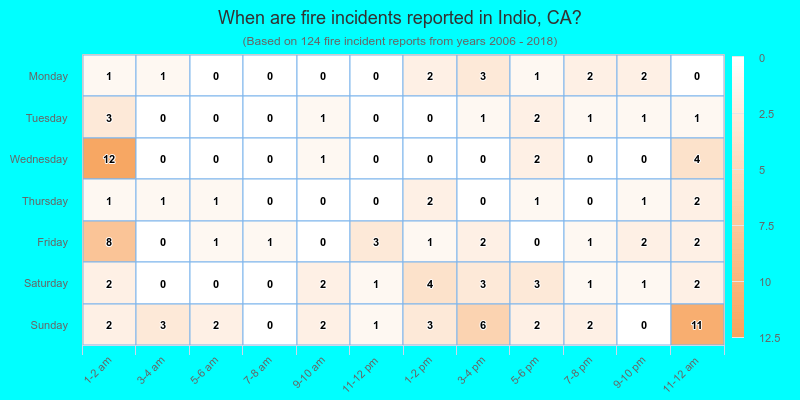
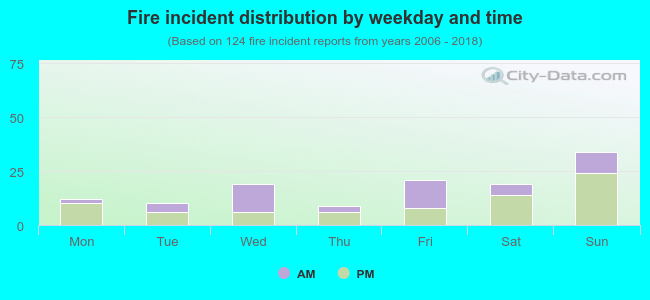 40.3% incidents where reported in the morning and 59.7% in the evening. The most fires (27.4%) took place on Sunday, and the least (7.3%) on Thursday.
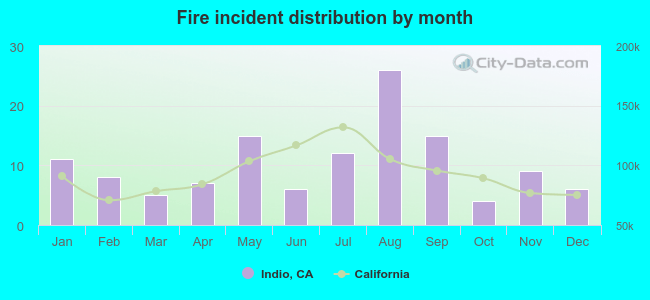 According to the 124 incident reports from years 2006 - 2018 most fires (21.0%) took place during August, and the least (3.2%) in October.
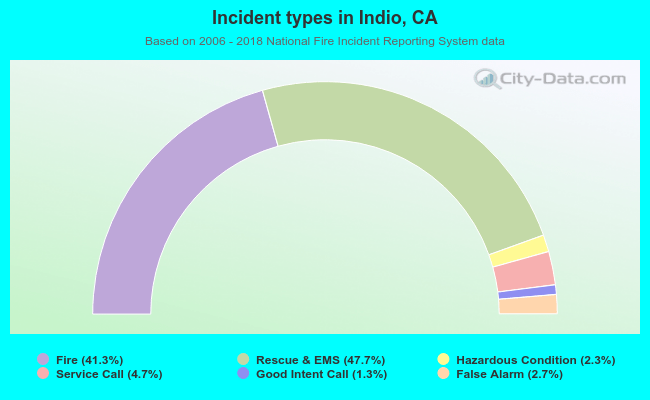 Out of all 300 cases reported during the years 2006 - 2018, the most belonged to the categories: Overpressure Rupture (47.7%), Fire (41.3%), and Hazardous Condition (4.7%).
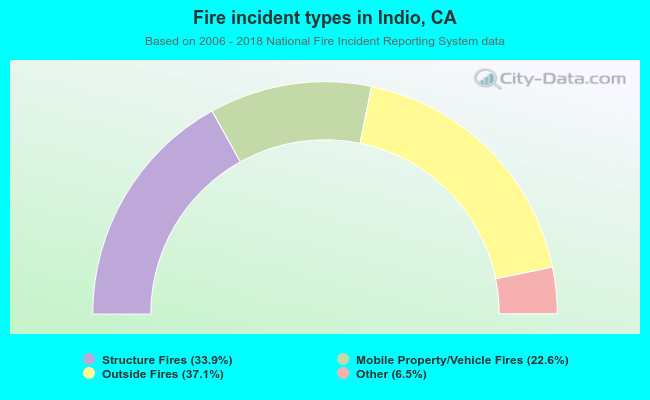 When looking into fire subcategories, the most reports belonged to: Outside Fires (37.1%), and Structure Fires (33.9%).