| Fire incidents reported |
|---|
| Sreet name | Count |
|---|
| SOUTH ST | 12 | | SUMMUM RD | 8 | | US 136 HWY | 8 | | 721 E SOUTH ST | 6 | | BROADWAY ST | 4 | | CO 2 HWY | 4 | | COUNTY 2 HWY | 4 | | MILE LOAD RD | 4 | | OLD BRIDGE RD | 4 | | OTTER CREEK RD | 4 | | SOUTH ST | 4 | | TATER CREEK RD | 4 | | US 136 | 4 | | W MAIN | 4 | | 100324 N PLANT RD | 2 | | 10206 N CO 2 HWY | 2 | | 10250 N OTTER CREEK RD | 2 | | 10350 N BRANSON SCHOOL RD | 2 | | 10354 N CARLS LANE | 2 | | 10471 N OTTER CREEK RD | 2 | | 10765 N BEADLES RD. | 2 | | 11501 N CO 2 | 2 | | 11735 N TATER CREEK RD | 2 | | 11735 N TATER CREEK RD | 2 | | 11735 N. TATER CREEK RD | 2 |
| | | Fire incidents reported |
|---|
| Sreet name | Count |
|---|
| 11982 MILE LOAD RD | 2 | | 12381 N TATER CREEK RD | 2 | | 136 US HWY | 2 | | 14510 N OLD BRIDGE RD | 2 | | 1502 E US 136 | 2 | | 300 W BROADWAY ST | 2 | | 391 BRODWAY | 2 | | 391 W BRDWY | 2 | | 409 N PEARL ST | 2 | | 70 W MAIN | 2 | | 700 E SOUTH | 2 | | 7132 N OAK TREE RD | 2 | | 720 E SOUTH ST | 2 | | 721 E SOUTH | 2 | | 7515 N BRANSON SCHOOL RD | 2 | | 7765 N CO 2 HWY | 2 | | 7765 N COUNTY ROAD 2 | 2 | | 80 E SOUTH ST | 2 | | 8030 E ELROD RD | 2 | | 81 N NORTHST | 2 | | 8369 US 136 HWY | 2 | | 8484 N OTTER CREEK RD | 2 | | 8691 E SQUIRREL RD | 2 | | 871 E MAIN ST. | 2 | | |
|
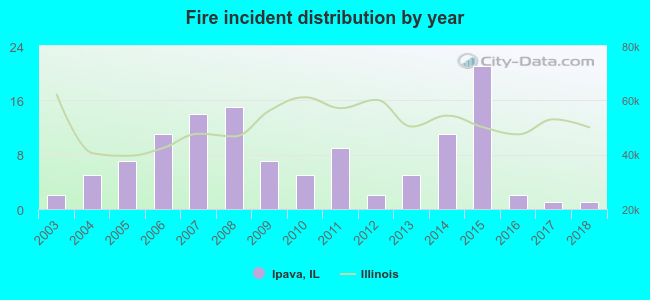 According to the data from the years 2003 - 2018 the average number of fire incidents per year is 7. The highest number of reported fire incidents - 21 took place in 2015, and the least - 1 in 2017. The data has a declining trend.
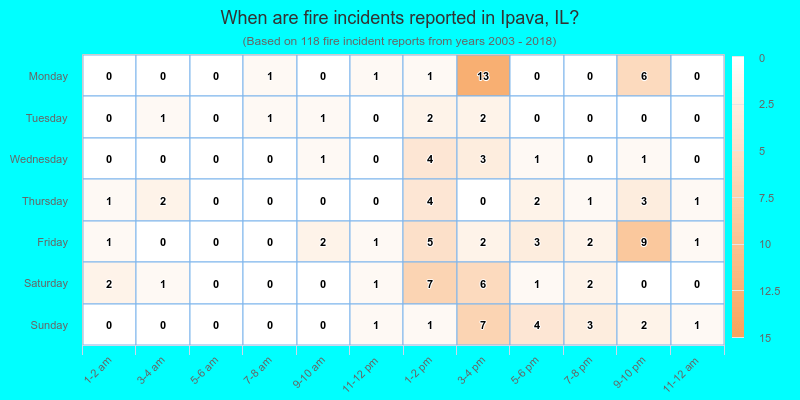
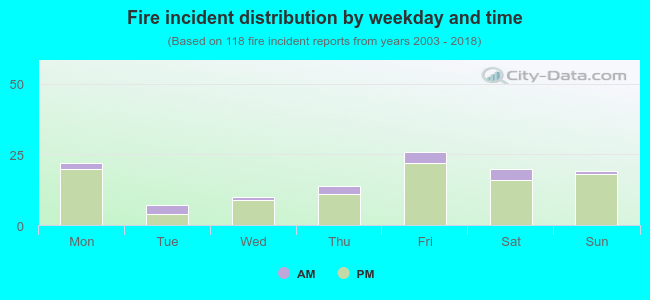 15.3% incidents where reported in the morning and 84.7% in the evening. The most fires (22.0%) took place on Friday, and the least (5.9%) on Tuesday.
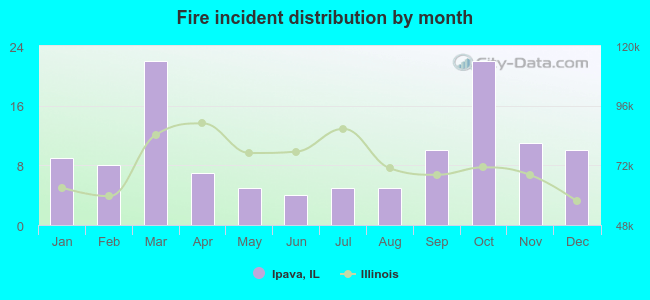 According to the 118 fire incident reports from years 2003 - 2018 most fires (18.6%) took place during March, and the least (3.4%) in June.
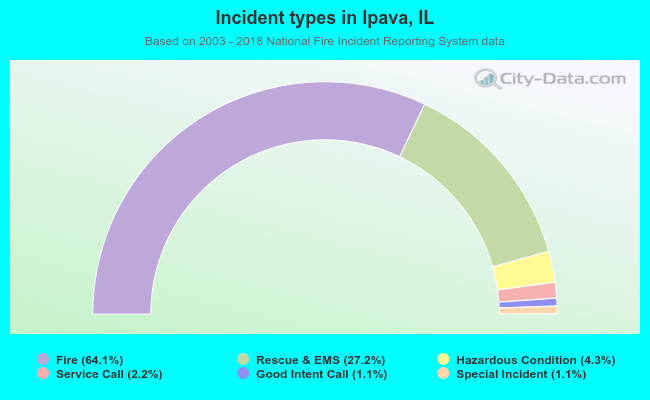 Out of all 184 cases reported during the years 2003 - 2018, the most belonged to the categories: Fire (64.1%), Overpressure Rupture (27.2%), and Rescue & EMS (4.3%).
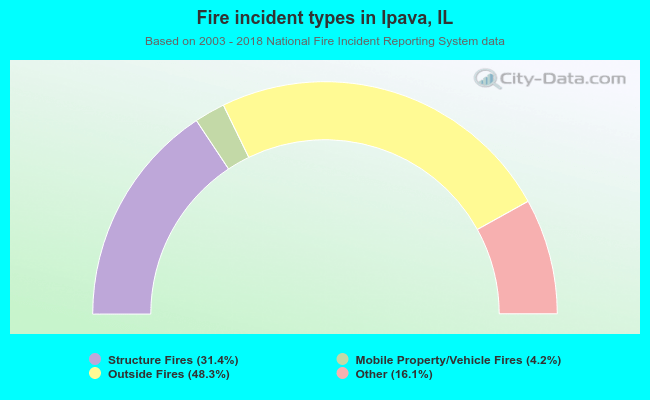 When looking into fire subcategories, the most incidents belonged to: Outside Fires (48.3%), and Structure Fires (31.4%).