| Fire incidents reported |
|---|
| Sreet name | Count |
|---|
| HAGERMAN LAKE RD | 8 | | HIAWATHA RD | 8 | | SMOKEY LAKE RD | 8 | | 10 WEST CAYUGA AVE | 6 | | 4TH AVE | 6 | | BAUMGARTNER RD | 6 | | US HWY 2 | 6 | | 1001 STAMBAUGH AVE | 4 | | 1136 N 10TH AVE | 4 | | 1203 N 1ST AVE | 4 | | 1272 M-73 | 4 | | 129 ERICKSON ROAD | 4 | | 145 DUNKEL RD | 4 | | 208 JEFFERSON AVE | 4 | | 236 N 3RD AVE | 4 | | 271 SOUTH BRULE RD | 4 | | 626 BAUMGARTNER RD | 4 | | BASSWOOD RD | 4 | | BOYINGTON ST | 4 | | CEDAR AVE | 4 | | IRIS ST | 4 | | IRON LAKE ROAD | 4 | | PENTOGA TRL | 4 | | SLEEPY HOLLOW WAY | 4 | | SOUTH BRULE RD | 4 |
| | | Fire incidents reported |
|---|
| Sreet name | Count |
|---|
| SUNSET LAKE RD | 4 | | 1009 N 5TH AVE | 2 | | 101 DIVISION ST | 2 | | 1014 HIAWATHA RD | 2 | | 1016 FRANKLIN ST | 2 | | 1017 5TH AVE | 2 | | 1017 NORTH FIFTH AVE | 2 | | 1029 BAUMGARTNER RD | 2 | | 103 BERHARDT RD | 2 | | 103 MINERAL AVE | 2 | | 104 SELDON ROAD | 2 | | 104 STANLEY LAKE ROAD | 2 | | 1040 LALLEY RD | 2 | | 1043 W FRANKLIN ST | 2 | | 105 DEERTRAIL | 2 | | 107 EAST ROSS STREET | 2 | | 107 HIGH VIEW RD | 2 | | 1078 BATES AMASA ROAD | 2 | | 108 MEADOWVIEW DRIV | 2 | | 1080 GIBBS CITY RD | 2 | | 109 LUNDIN DRIVE | 2 | | 11 1ST AVE | 2 | | 110 EAST HILL ROAD RD | 2 | | 1119 NORTH RIVER AVE | 2 | | |
|
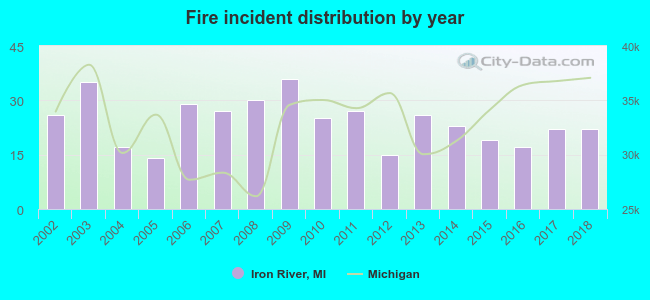 According to the data from the years 2002 - 2018 the average number of fires per year is 24. The highest number of fire incidents - 36 took place in 2009, and the least - 14 in 2005. The data has a decreasing trend.
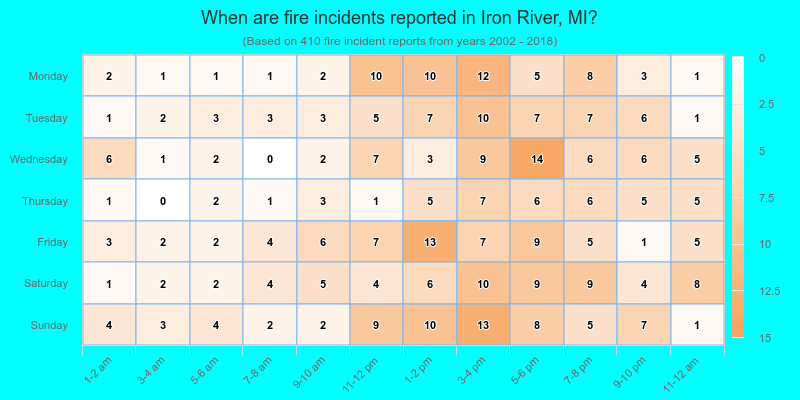
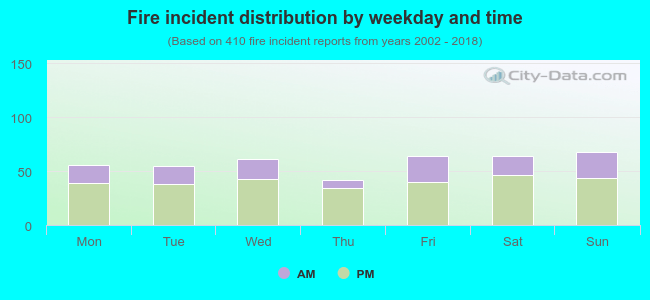 30.7% incidents where reported in the morning and 69.3% in the evening. The most fires (16.6%) took place on Sunday, and the least (10.2%) on Thursday.
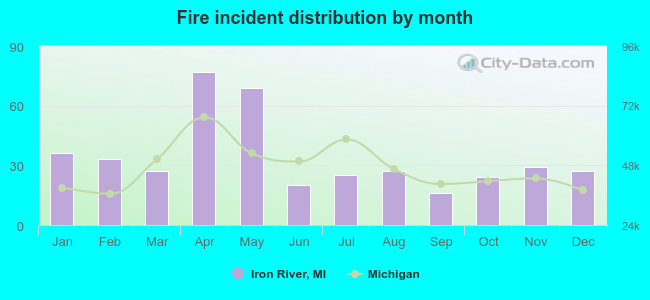 According to the 410 incident reports from years 2002 - 2018 most fires (18.8%) took place during April, and the least (3.9%) in September.
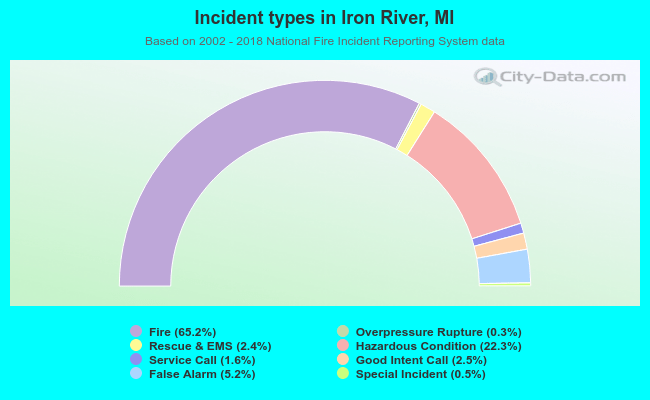 Out of all 629 cases reported during the years 2002 - 2018, the most belonged to the categories: Fire (65.2%), Hazardous Condition (22.3%), and False Alarm (5.2%).
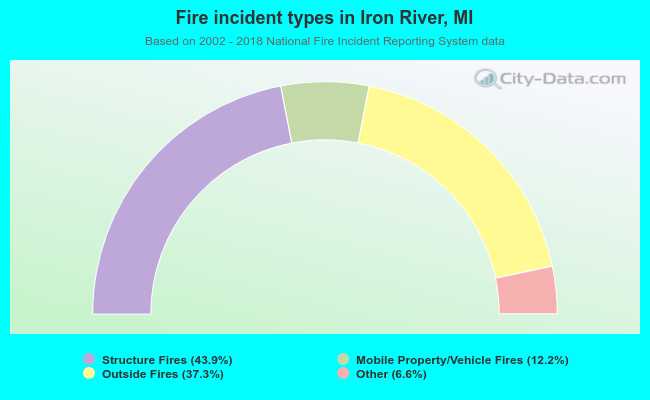 When looking into fire subcategories, the most incidents belonged to: Structure Fires (43.9%), and Outside Fires (37.3%).