| Fire incidents reported |
|---|
| Sreet name | Count |
|---|
| ARROW | 102 | | IRWINDALE | 52 | | BUENA VISTA | 24 | | FOOTHILL | 22 | | NB 605 SO 210 | 18 | | ALPHA | 16 | | EB 210 AT 605 | 16 | | EB 210 AT IRWINDALE | 16 | | LIVE OAK | 16 | | NB 605 SO LIVE OAK | 16 | | CYPRESS | 14 | | PECK | 14 | | EB 210 EO IRWINDALE | 12 | | WB 210 AT 605 | 12 | | 4TH | 10 | | IRWINDALE AV/210 | 10 | | RIVERGRADE | 10 | | SB 605 NO ARROW | 10 | | SB 605 NO LOWER AZUSA | 10 | | WB 210 EO 605 | 10 | | 1ST | 8 | | AZUSA CANYON | 8 | | CENTRAL | 8 | | EB 210 TO 605 FWY SB | 8 | | FWY | 8 |
| | | Fire incidents reported |
|---|
| Sreet name | Count |
|---|
| NB 605 AT LOWER AZUSA | 8 | | NB 605 NO ARROW | 8 | | NB 605 NO RAMONA | 8 | | SB 605 AT LOWER AZUSA | 8 | | SB 605 AT RAMONA | 8 | | SB 605 NO RAMONA | 8 | | AYON | 6 | | EB 210 WO 605 | 6 | | EB 210 WO IRWINDALE | 6 | | LOS ANGELES | 6 | | NB 605 AT 210 | 6 | | NB 605 NO LOWER AZUSA | 6 | | NB 605 SO ARROW | 6 | | NB 605 TO 210 FWY EB | 6 | | NORA | 6 | | SB 605 SO 210 | 6 | | SB 605 SO LIVE OAK | 6 | | VINCENT | 6 | | WB 210 AT MT OLIVE | 6 | | WB 210 WO IRWINDALE | 6 | | ARROW HWY | 4 | | ARROW HWY605 | 4 | | AVENIDA PADILLA | 4 | | AYALA | 4 | | CHARTER | 4 |
|
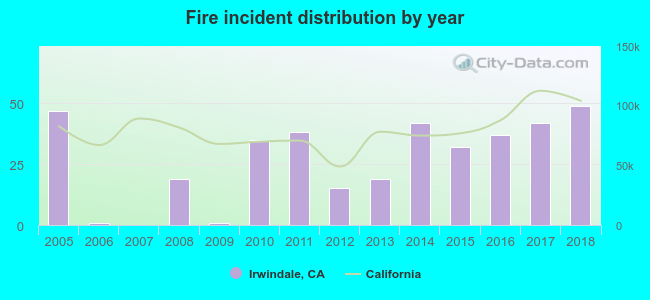 Based on the data from the years 2005 - 2018 the average number of fire incidents per year is 27. The highest number of fires - 49 took place in 2018, and the least - 0 in 2007. The data has a rising trend.
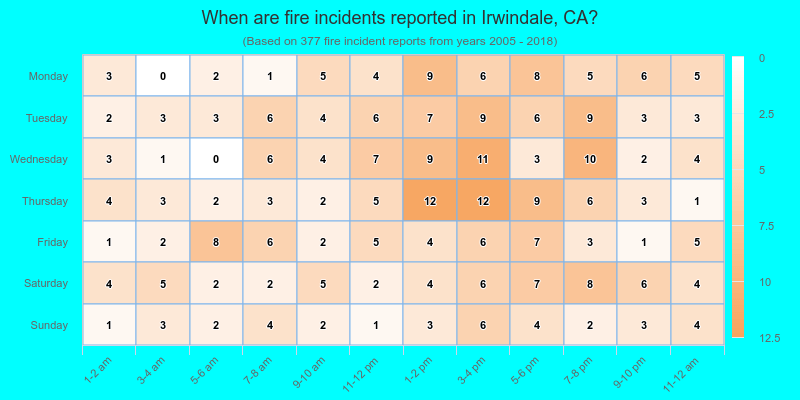
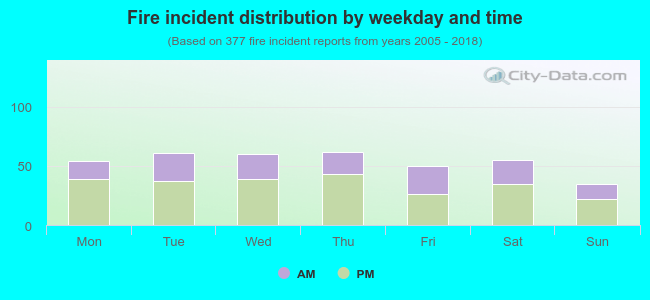 36.1% incidents where reported in the morning and 63.9% in the evening. The most fires (16.4%) took place on Thursday, and the least (9.3%) on Sunday.
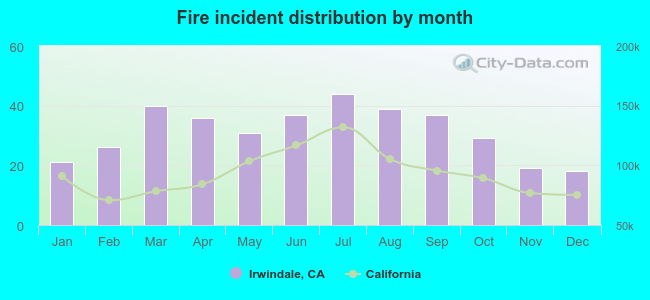 According to the 377 fire incident reports from years 2005 - 2018 most fires (11.7%) took place during July, and the least (4.8%) in December.
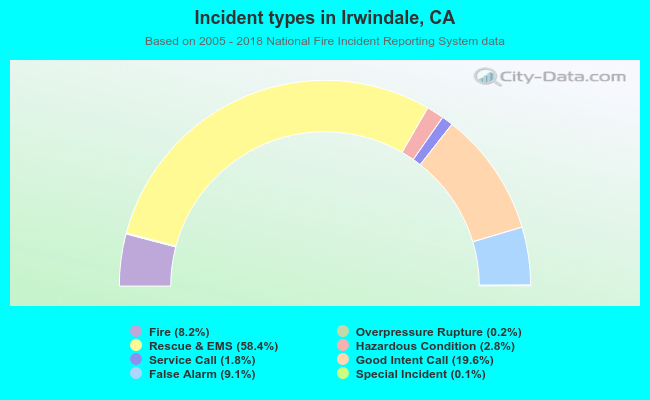 Out of all 4,618 cases reported during the years 2005 - 2018, the most belonged to the categories: Rescue & EMS (58.4%), Good Intent Call (19.6%), and False Alarm (9.1%).
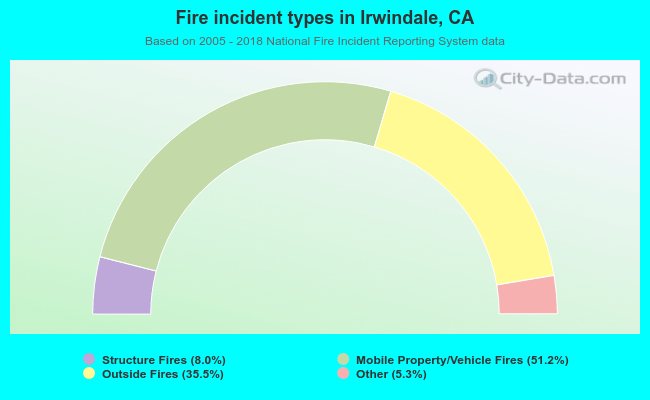 When looking into fire subcategories, the most incidents belonged to: Mobile Property/Vehicle Fires (51.2%), and Outside Fires (35.5%).