| Fire incidents reported |
|---|
| Sreet name | Count |
|---|
| TALBOT RD | 62 | | INTERSTATE 5 FWY | 32 | | MAIN ST | 28 | | ANKENY HILL RD | 24 | | BUENA VISTA RD | 20 | | JEFFERSON HWY | 20 | | 5TH ST | 18 | | JEFFERSON MARION RD | 18 | | JEFFERSONSCIO DR | 16 | | PARRISH GAP RD | 16 | | WINTEL RD | 16 | | 2ND ST | 14 | | WALL LN | 14 | | JEFFERSON SCIO DR | 12 | | PINE ST | 12 | | SKELTON RD | 12 | | WESTSIDE LN | 12 | | JEFFERSON SCIO RD | 10 | | MILLER RD | 10 | | STEIWER RD | 10 | | OAK ST | 8 | | WINTERCREEK RD | 8 | | FERRY ST | 6 | | GREENS BRIDGE RD | 6 | | HAZEL ST | 6 |
| | | Fire incidents reported |
|---|
| Sreet name | Count |
|---|
| HELEN ST | 6 | | I5 SB 241 REST AREA HWY | 6 | | JULIA LN | 6 | | LIBBY LN | 6 | | MARION RD | 6 | | MARLATT RD | 6 | | MEADOWOOD CT | 6 | | OAKDALE CT | 6 | | SALAMANDER RD | 6 | | UNION ST | 6 | | 5 FWY | 4 | | 54TH AVE | 4 | | 6TH ST | 4 | | ANKNEY HILL RD | 4 | | CHURCH ST | 4 | | EIDER ST | 4 | | HOCHSPEIER RD | 4 | | HURON CT | 4 | | I-5 NB 241 REST AREA | 4 | | I5 FWY | 4 | | I5 NB 241 REST AREA | 4 | | I5 SB 241 REST AREA FWY | 4 | | I5 SB NEAR MP 239 | 4 | | INTERSTATE 5 239 SB | 4 | | INTERSTATE 5 AT MP 239 | 4 |
|
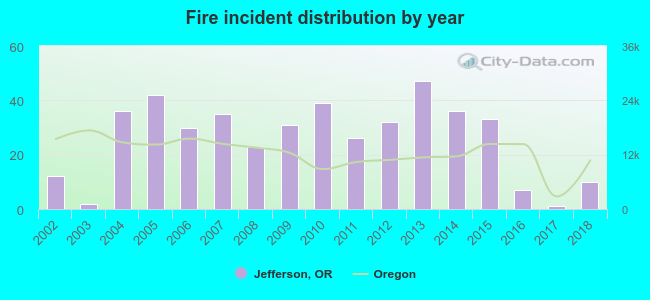 Based on the data from the years 2002 - 2018 the average number of fires per year is 26. The highest number of fires - 47 took place in 2013, and the least - 1 in 2017. The data has a decreasing trend.
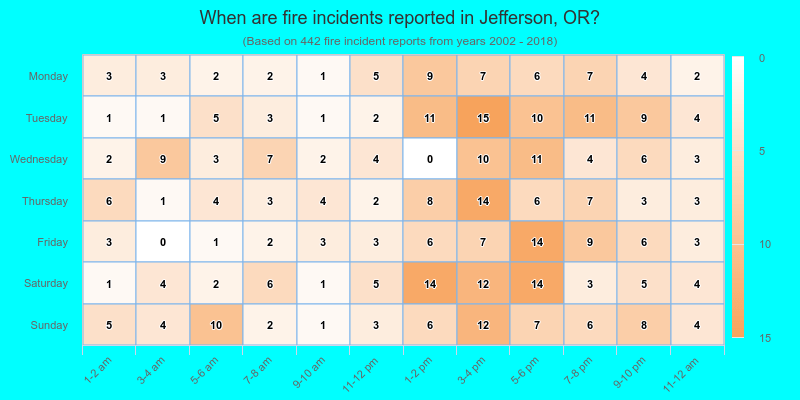
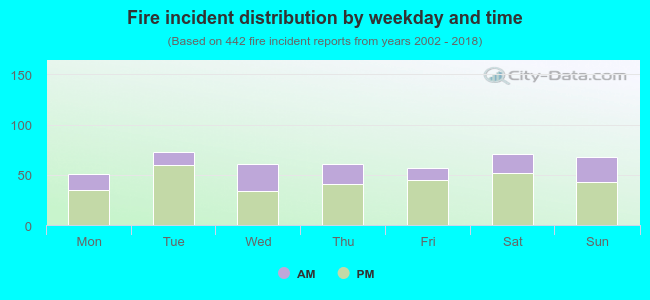 29.9% incidents where reported in the morning and 70.1% in the evening. The most fires (16.5%) took place on Tuesday, and the least (11.5%) on Monday.
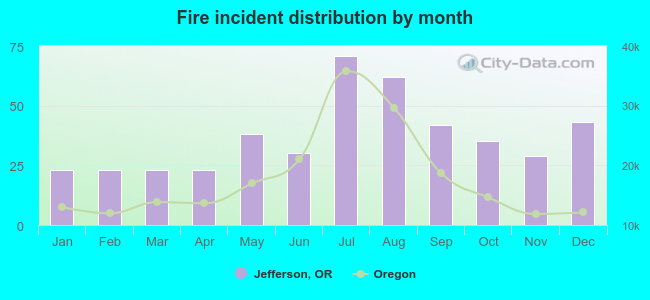 According to the 442 incident reports from years 2002 - 2018 most fires (16.1%) took place during July, and the least (5.2%) in January.
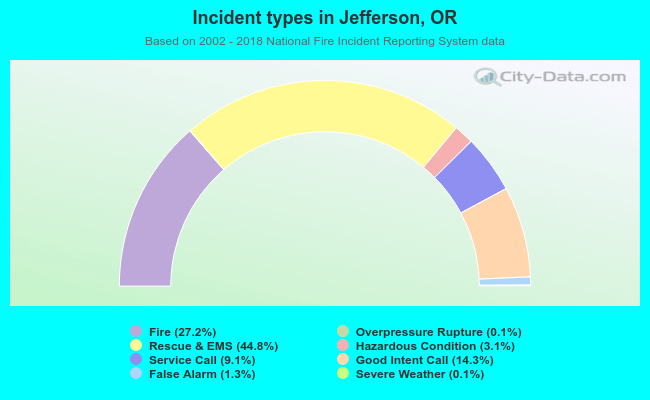 Out of all 1,624 cases reported during the years 2002 - 2018, the most belonged to the categories: Rescue & EMS (44.8%), Fire (27.2%), and Good Intent Call (14.3%).
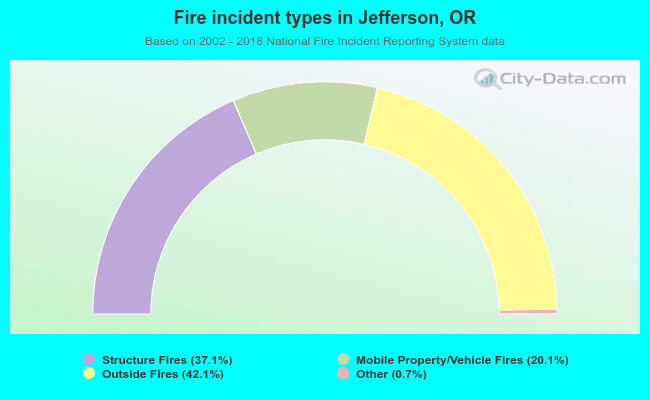 When looking into fire subcategories, the most incidents belonged to: Outside Fires (42.1%), and Structure Fires (37.1%).