Justice: Fire Incidents, Illinois (IL)
Where are fire incidents reported in Justice, IL
Something went wrong! Please refresh the page.
| Fire incidents reported | |
|---|---|
| Sreet name | Count |
| 86TH AVE | 176 |
| 87TH AVE | 144 |
| 79TH ST | 116 |
| 88TH AVE | 108 |
| HICKORY TRACE DR | 82 |
| 85TH PL | 56 |
| I294 | 56 |
| MARION DR | 56 |
| 84TH ST | 54 |
| 82ND AVE | 46 |
| 85TH ST | 46 |
| ROBERTS RD | 44 |
| 88TH TER | 38 |
| VICTORY LN | 36 |
| 86TH ST | 32 |
| CORK AVE | 32 |
| OAK LN | 32 |
| 83RD ST | 30 |
| GARDEN LN | 30 |
| 82ND CT | 28 |
| 83RD AVE | 28 |
| 83RD PL | 28 |
| 84TH CT | 26 |
| ARCHER RD | 26 |
| 86TH PL | 24 |
| CONCORD LN | 24 |
| 83RD CT | 22 |
| BLACKSTONE AVE | 22 |
| TESTA DR | 22 |
| 84TH PL | 20 |
2002 - 2018 National Fire Incident Reporting System (NFIRS) incidents
- Incident types reported to NFIRS in Justice, IL
- 6,58950.8%Rescue & EMS
- 1,38210.6%Hazardous Condition
- 1,37410.6%Good Intent Call
- 1,2599.7%Fire
- 1,2119.3%Service Call
- 1,1388.8%False Alarm
- 190.1%Overpressure Rupture
- Fire incident types reported to NFIRS in Justice, IL
- 78462.3%Structure Fires
- 26320.9%Outside Fires
- 16012.7%Mobile Property/Vehicle Fires
- 524.1%Other
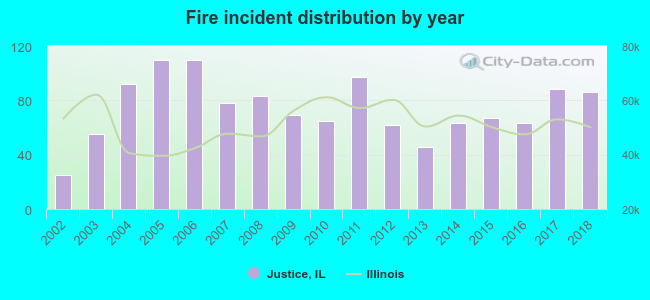 According to the data from the years 2002 - 2018 the average number of fires per year is 74. The highest number of reported fires - 110 took place in 2005, and the least - 25 in 2002. The data has an increasing trend.
The average number of yearly fire incidents per 10k residents in Justice, IL compared to nearest cities:
(Note: Based on data for the last 3 years, including only cities with population 5,000 and above)
| Justice: | 60.7 |
| Bridgeview: | 83.7 |
| Hickory Hills: | 40.0 |
| Willow Springs: | 46.1 |
| Countryside: | 48.1 |
| Summit: | 57.7 |
| Palos Hills: | 37.6 |
| Burbank: | 31.9 |
| Chicago Ridge: | 54.5 |
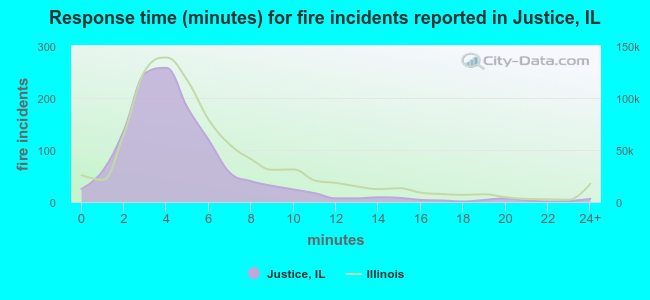 The median response time based on all reported fire incidents is 4 minutes. This is lower than the Illinois median value.
The median response time in Justice, IL compared to nearest cities:
(Note: Based on data for all years, including only cities with at least 500 fire incidents)
| Justice: | 4 minutes |
| Bridgeview: | 5 minutes |
| Hickory Hills: | 4 minutes |
| Bedford Park: | 5 minutes |
| Summit: | 5 minutes |
| Palos Hills: | 4 minutes |
| Burbank: | 4 minutes |
| Chicago Ridge: | 5 minutes |
| Burr Ridge: | 7 minutes |
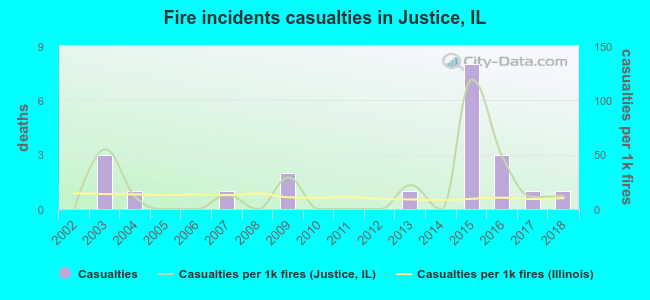 According to the reports from the years 2002 - 2018 the average number of fire-related yearly casualties is 1. The highest number of reported injuries - 8 took place in 2015, and the lowest - 0 in 2002. The data has an increasing trend.
The average number of injuries per 1,000 fires is 19. This indicator was the highest - 119 in 2015, and the lowest 0 in 2002. The trend for casualties per 1,000 fire incidents is growing. Compared to the Illinois value the number of injuries per 1,000 fire incidents is higher.
According to the reports from the years 2002 - 2018 the average number of fire-related yearly casualties is 1. The highest number of reported injuries - 8 took place in 2015, and the lowest - 0 in 2002. The data has an increasing trend.
The average number of injuries per 1,000 fires is 19. This indicator was the highest - 119 in 2015, and the lowest 0 in 2002. The trend for casualties per 1,000 fire incidents is growing. Compared to the Illinois value the number of injuries per 1,000 fire incidents is higher.Casualties per 1,000 incidents in Justice, IL compared to nearest cities:
(Note: Based on data for all years, including only cities with at least 500 fire incidents)
| Justice: | 16.7 |
| Bridgeview: | 13.5 |
| Hickory Hills: | 21.9 |
| Bedford Park: | 4.4 |
| Summit: | 14.3 |
| Palos Hills: | 12.1 |
| Burbank: | 18.2 |
| Chicago Ridge: | 6.1 |
| Burr Ridge: | 14.3 |
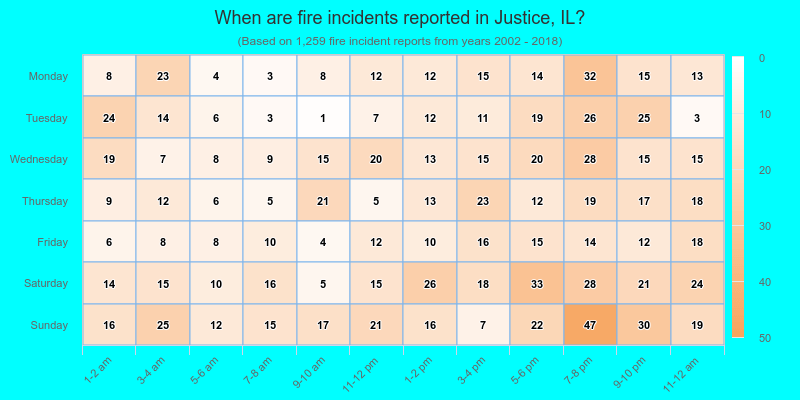
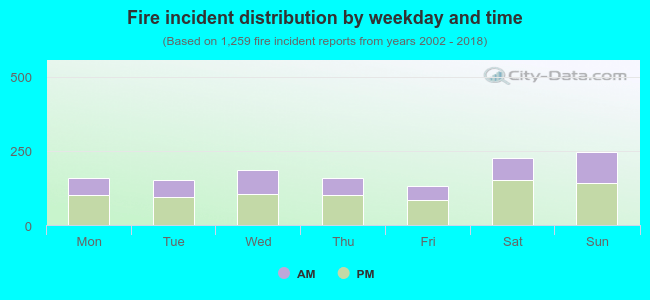 38.0% incidents where reported in the morning and 62.0% in the evening. The most fires (19.6%) took place on Sunday, and the least (10.6%) on Friday.
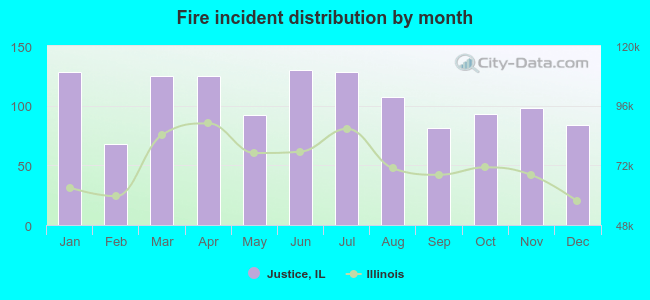 According to the 1,259 fire incident reports from years 2002 - 2018 most fires (10.3%) took place during June, and the least (5.4%) in February.
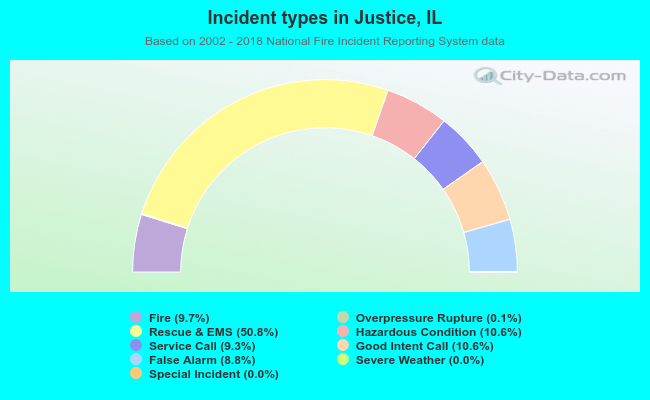 Out of all 12,978 cases reported during the years 2002 - 2018, the most belonged to the categories: Rescue & EMS (50.8%), Hazardous Condition (10.6%), and Good Intent Call (10.6%).
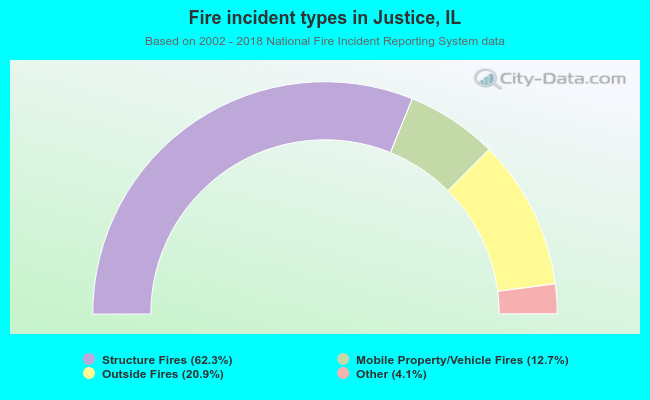 When looking into fire subcategories, the most reports belonged to: Structure Fires (62.3%), and Outside Fires (20.9%).