Kaunakakai: Fire Incidents, Hawaii (HI)
Where are fire incidents reported in Kaunakakai, HI
Something went wrong! Please refresh the page.
|
| |||||||||||||||||||||||||||||||||||||||||||||||||||||||||||||||||||||||||||||||||||||||||||||||||||||||||||||
2002 - 2018 National Fire Incident Reporting System (NFIRS) incidents
- Incident types reported to NFIRS in Kaunakakai, HI
- 1,33364.8%Rescue & EMS
- 24912.1%Fire
- 1577.6%Good Intent Call
- 1437.0%Service Call
- 1316.4%Hazardous Condition
- 391.9%False Alarm
- 30.1%Special Incident
- Fire incident types reported to NFIRS in Kaunakakai, HI
- 15461.8%Outside Fires
- 6425.7%Structure Fires
- 3012.0%Mobile Property/Vehicle Fires
- 10.4%Other
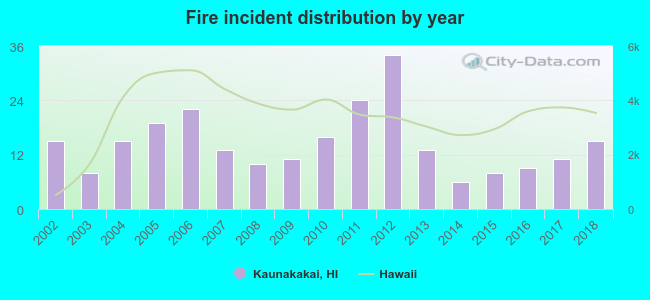 Based on the data from the years 2002 - 2018 the average number of fires per year is 15. The highest number of fire incidents - 34 took place in 2012, and the least - 6 in 2014. The data has a constant trend.
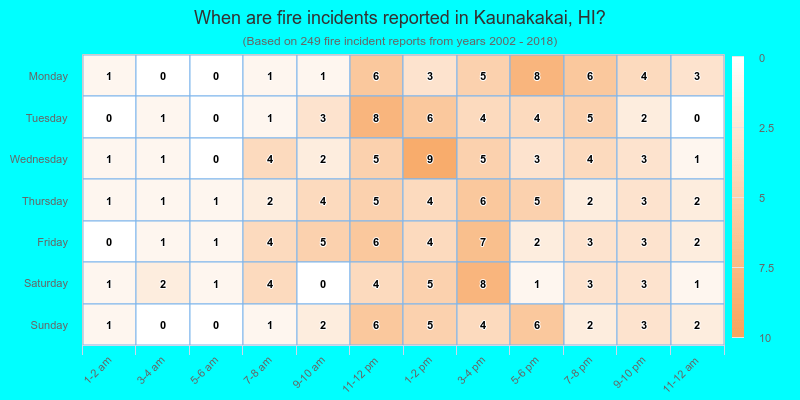
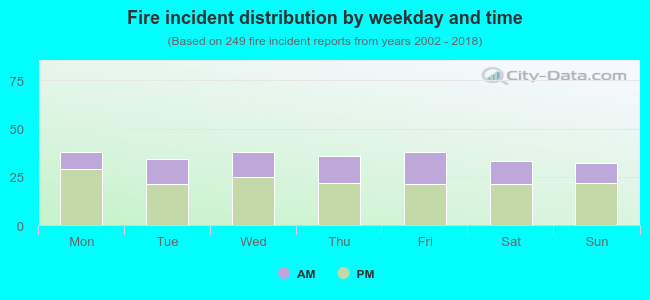 35.3% incidents where reported in the morning and 64.7% in the evening. The most fires (15.3%) took place on Monday, and the least (12.9%) on Sunday.
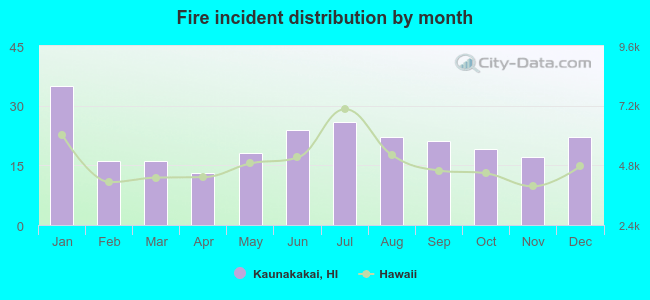 According to the 249 reports from years 2002 - 2018 most fires (14.1%) took place during January, and the least (5.2%) in April.
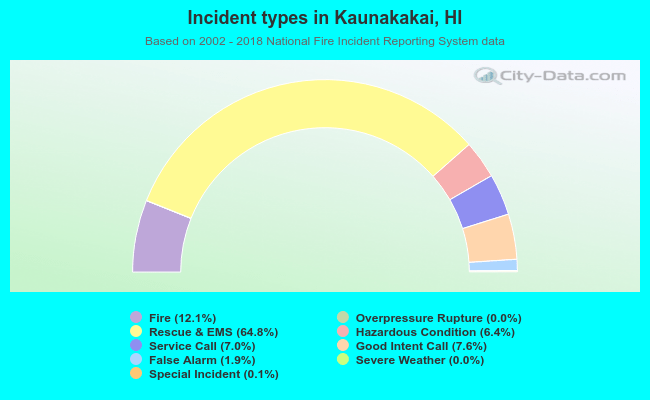 Out of all 2,057 cases reported during the years 2002 - 2018, the most belonged to the categories: Rescue & EMS (64.8%), Fire (12.1%), and Good Intent Call (7.6%).
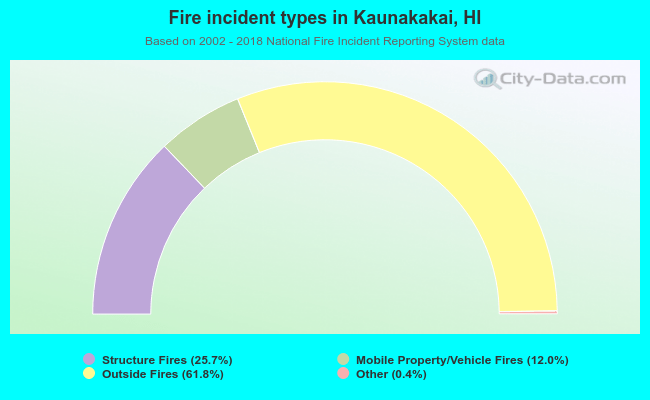 When looking into fire subcategories, the most reports belonged to: Outside Fires (61.8%), and Structure Fires (25.7%).