Kiowa: Fire Incidents, Kansas (KS)
Where are fire incidents reported in Kiowa, KS
Something went wrong! Please refresh the page.
|
| |||||||||||||||||||||||||||||||||||||||||||||||||||||||||||||||||||||||||||||||||||||||||||||||||||||||||
| Other | 167 | |||||||||||||||||||||||||||||||||||||||||||||||||||||||||||||||||||||||||||||||||||||||||||||||||||||||||
2002 - 2018 National Fire Incident Reporting System (NFIRS) incidents
- Incident types reported to NFIRS in Kiowa, KS
- 35377.8%Fire
- 419.0%Hazardous Condition
- 245.3%Rescue & EMS
- 194.2%Good Intent Call
- 71.5%Service Call
- 51.1%False Alarm
- 30.7%Severe Weather
- 10.2%Overpressure Rupture
- 10.2%Special Incident
- Fire incident types reported to NFIRS in Kiowa, KS
- 26374.5%Outside Fires
- 5615.9%Structure Fires
- 287.9%Mobile Property/Vehicle Fires
- 61.7%Other
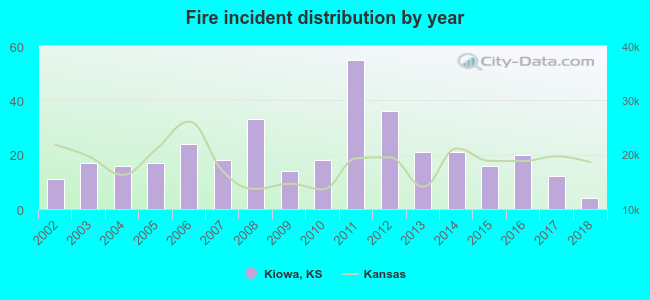 Based on the data from the years 2002 - 2018 the average number of fires per year is 21. The highest number of reported fires - 55 took place in 2011, and the least - 4 in 2018. The data has a dropping trend.
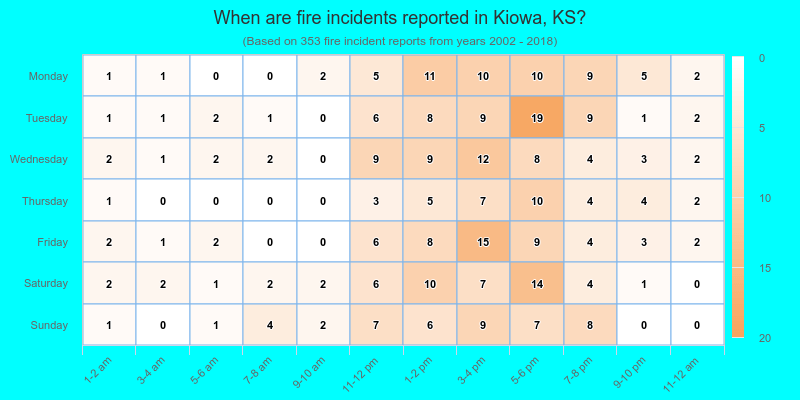
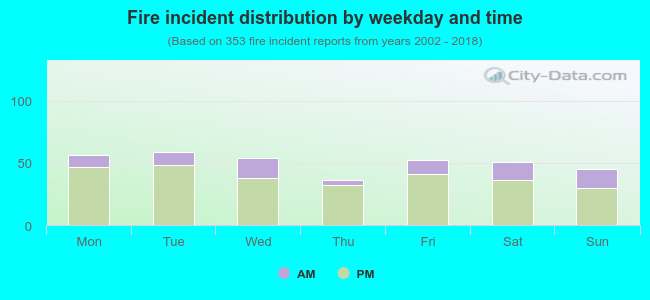 22.9% incidents where reported in the morning and 77.1% in the evening. The most fires (16.7%) took place on Tuesday, and the least (10.2%) on Thursday.
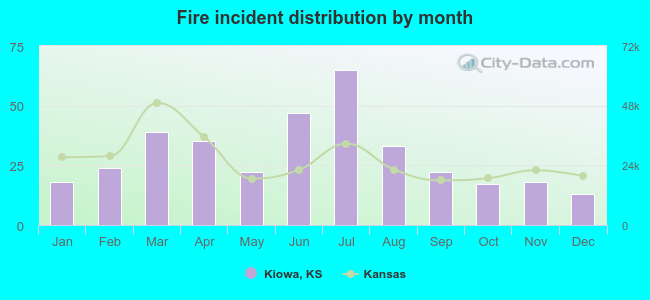 According to the 353 reports from years 2002 - 2018 most fires (18.4%) took place during July, and the least (3.7%) in December.
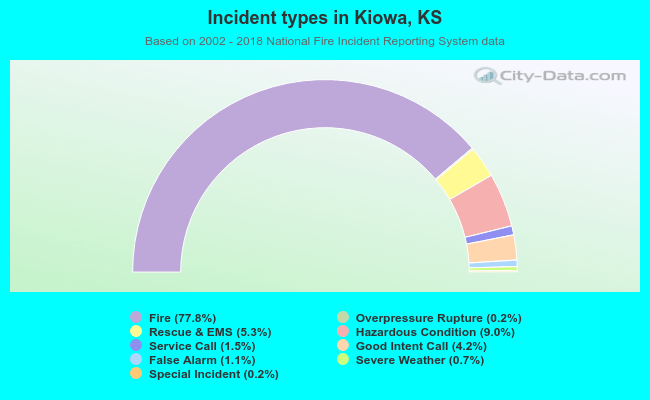 Out of all 454 cases reported during the years 2002 - 2018, the most belonged to the categories: Fire (77.8%), Hazardous Condition (9.0%), and Rescue & EMS (5.3%).
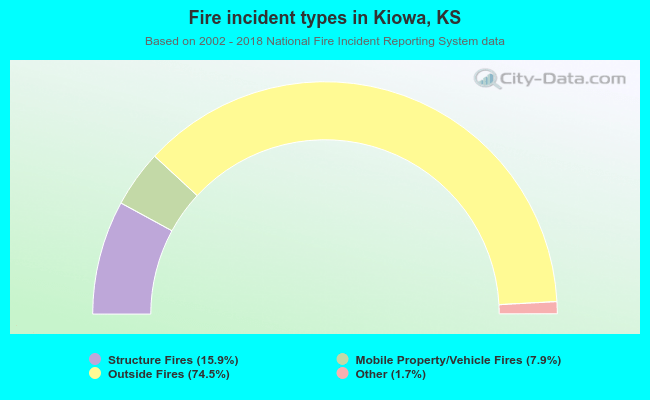 When looking into fire subcategories, the most incidents belonged to: Outside Fires (74.5%), and Structure Fires (15.9%).