La Grange Park: Fire Incidents, Illinois (IL)
Where are fire incidents reported in La Grange Park, IL
Something went wrong! Please refresh the page.
|
| |||||||||||||||||||||||||||||||||||||||||||||||||||||||||||||||||||||||||||||||||||||||||||||||||||||||||||||
2002 - 2018 National Fire Incident Reporting System (NFIRS) incidents
- Incident types reported to NFIRS in La Grange Park, IL
- 6,47777.3%Rescue & EMS
- 6287.5%False Alarm
- 5276.3%Hazardous Condition
- 3594.3%Good Intent Call
- 2873.4%Fire
- 750.9%Service Call
- 190.2%Severe Weather
- Fire incident types reported to NFIRS in La Grange Park, IL
- 18163.1%Structure Fires
- 6322.0%Outside Fires
- 227.7%Mobile Property/Vehicle Fires
- 217.3%Other
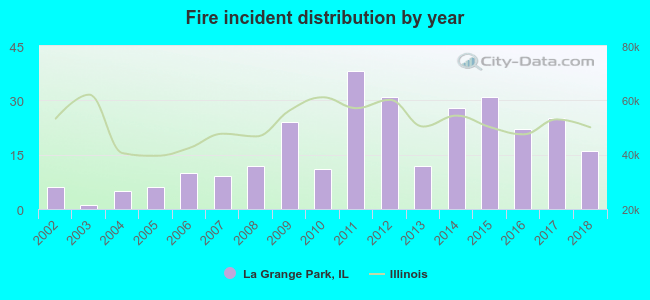 Based on the data from the years 2002 - 2018 the average number of fires per year is 17. The highest number of fires - 38 took place in 2011, and the least - 1 in 2003. The data has a growing trend.
The average number of yearly fire incidents per 10k residents in La Grange Park, IL compared to nearest cities:
(Note: Based on data for the last 3 years, including only cities with population 5,000 and above)
| La Grange Park: | 15.4 |
| Brookfield: | 36.6 |
| La Grange: | 20.1 |
| Westchester: | 37.1 |
| Broadview: | 57.0 |
| North Riverside: | 31.4 |
| Western Springs: | 18.3 |
| Lyons: | 67.8 |
| Riverside: | 20.6 |
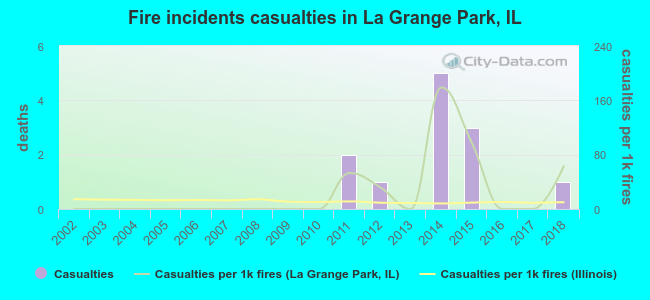 According to the reports from the years 2002 - 2018 the average number of fire-related yearly casualties is 1. The highest number of injuries - 5 took place in 2014, and the lowest - 0 in 2002. The data has a growing trend.
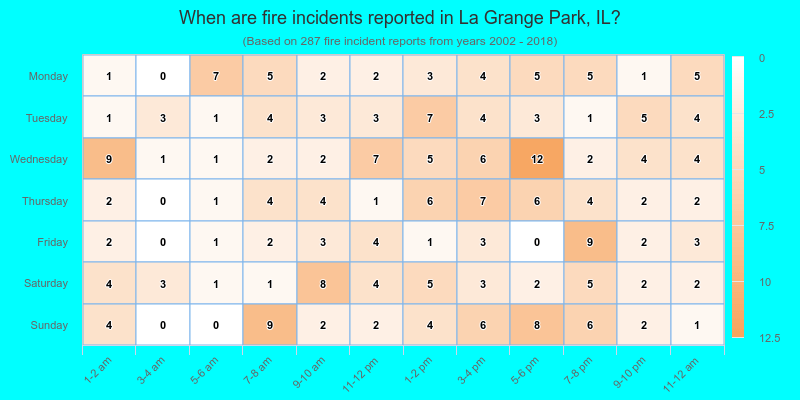
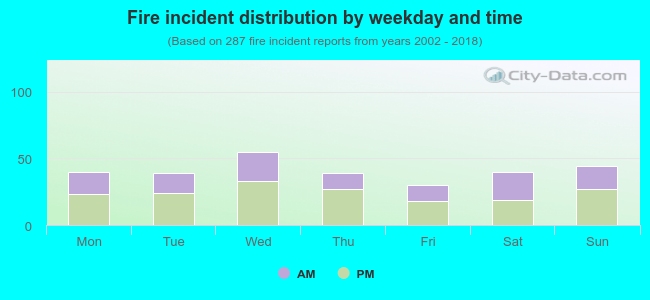 40.4% incidents where reported in the morning and 59.6% in the evening. The most fires (19.2%) took place on Wednesday, and the least (10.5%) on Friday.
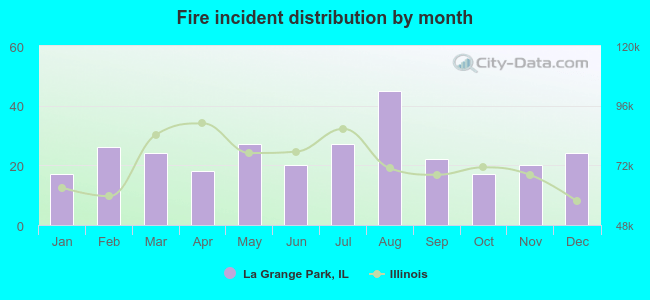 Based on the 287 fires from years 2002 - 2018 most fires (15.7%) took place during August, and the least (5.9%) in January.
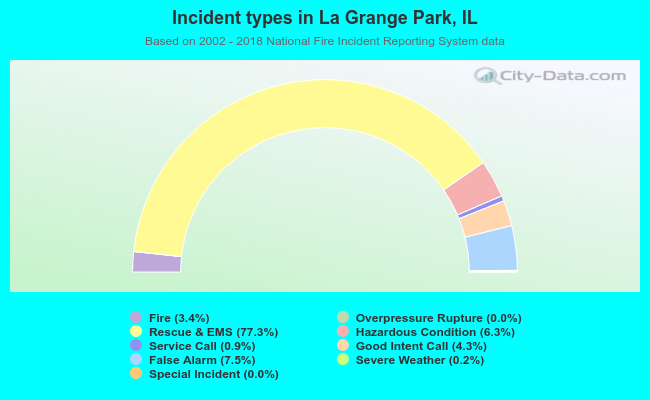 Out of all 8,374 cases reported during the years 2002 - 2018, the most belonged to the categories: Rescue & EMS (77.3%), False Alarm (7.5%), and Hazardous Condition (6.3%).
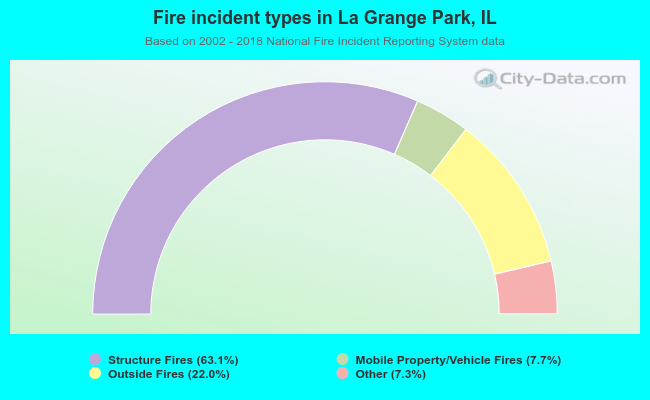 When looking into fire subcategories, the most incidents belonged to: Structure Fires (63.1%), and Outside Fires (22.0%).