La Jara: Fire Incidents, Colorado (CO)
Where are fire incidents reported in La Jara, CO
Something went wrong! Please refresh the page.
|
| |||||||||||||||||||||||||||||||||||||||||||||||||||||||||||||||||||||||||||||||||||||||||||||||||||||||||||||
2006 - 2018 National Fire Incident Reporting System (NFIRS) incidents
- Incident types reported to NFIRS in La Jara, CO
- 18176.7%Fire
- 2912.3%Good Intent Call
- 114.7%Hazardous Condition
- 73.0%Rescue & EMS
- 52.1%False Alarm
- 31.3%Service Call
- Fire incident types reported to NFIRS in La Jara, CO
- 12569.1%Outside Fires
- 4625.4%Structure Fires
- 63.3%Mobile Property/Vehicle Fires
- 42.2%Other
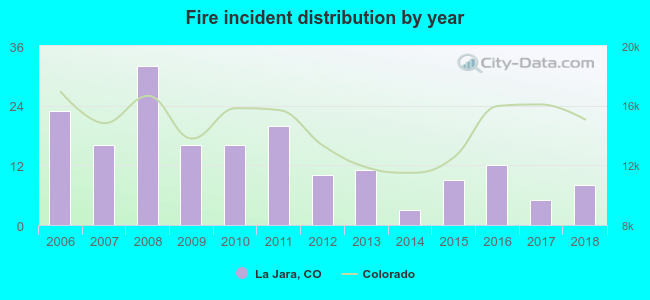 Based on the data from the years 2006 - 2018 the average number of fire incidents per year is 14. The highest number of reported fire incidents - 32 took place in 2008, and the least - 3 in 2014. The data has a decreasing trend.
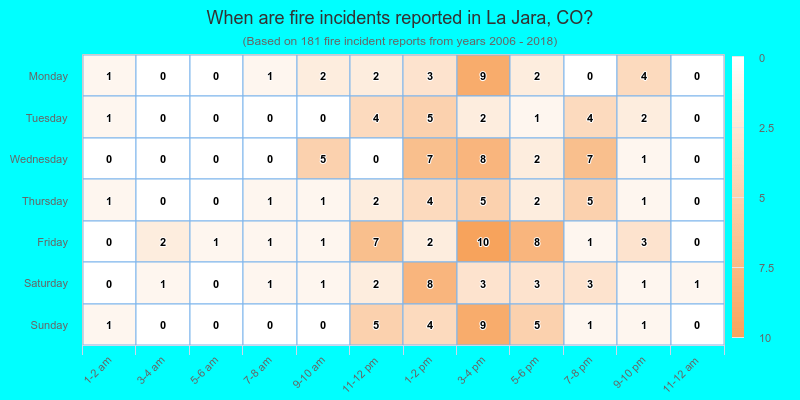
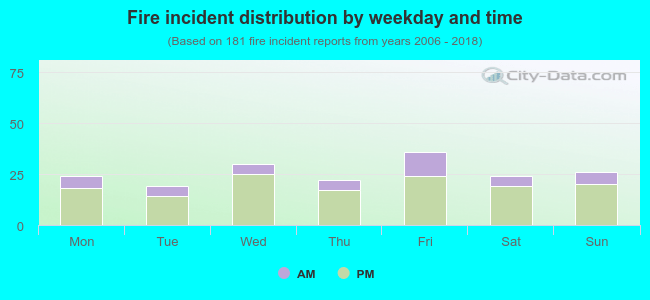 24.3% incidents where reported in the morning and 75.7% in the evening. The most fires (19.9%) took place on Friday, and the least (10.5%) on Tuesday.
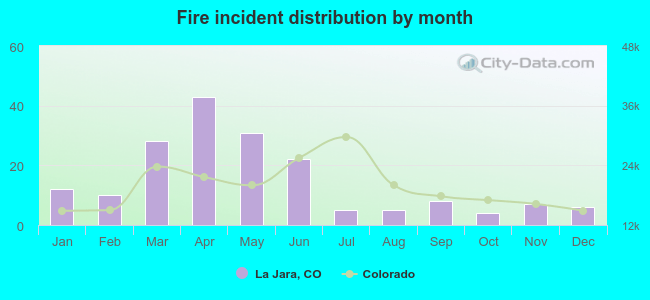 According to the 181 reports from years 2006 - 2018 most fires (23.8%) took place during April, and the least (2.2%) in October.
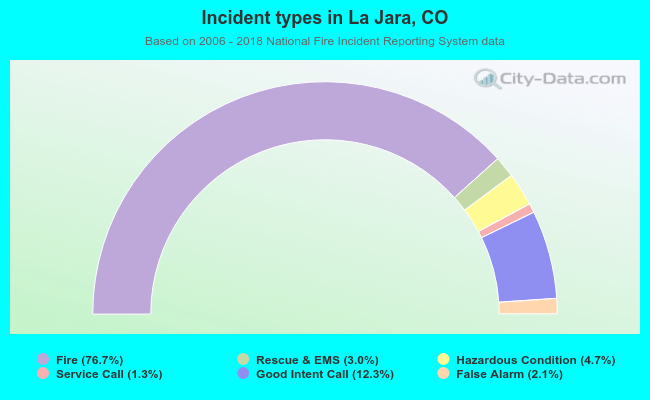 Out of all 236 cases reported during the years 2006 - 2018, the most belonged to the categories: Fire (76.7%), Service Call (12.3%), and Rescue & EMS (4.7%).
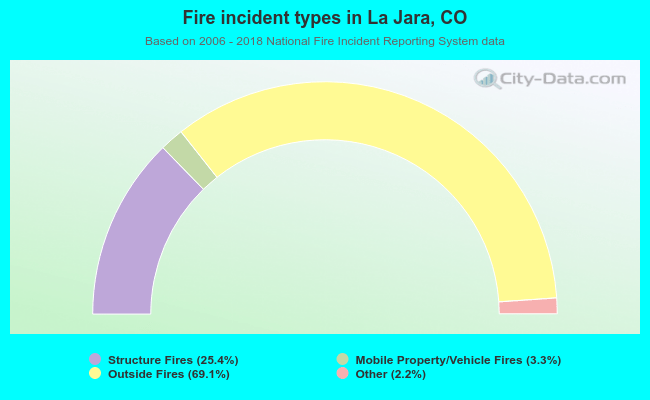 When looking into fire subcategories, the most incidents belonged to: Outside Fires (69.1%), and Structure Fires (25.4%).