Lake City: Fire Incidents, Minnesota (MN)
Where are fire incidents reported in Lake City, MN
Something went wrong! Please refresh the page.
|
| |||||||||||||||||||||||||||||||||||||||||||||||||||||||||||||||||||||||||||||||||||||||||||||||||||||||||||||
| Other | 72 | |||||||||||||||||||||||||||||||||||||||||||||||||||||||||||||||||||||||||||||||||||||||||||||||||||||||||||||
2002 - 2018 National Fire Incident Reporting System (NFIRS) incidents
- Incident types reported to NFIRS in Lake City, MN
- 30435.9%Fire
- 21925.9%Rescue & EMS
- 12815.1%Hazardous Condition
- 8710.3%Good Intent Call
- 688.0%False Alarm
- 192.2%Service Call
- 91.1%Severe Weather
- 91.1%Special Incident
- 40.5%Overpressure Rupture
- Fire incident types reported to NFIRS in Lake City, MN
- 11337.2%Structure Fires
- 10634.9%Outside Fires
- 6320.7%Mobile Property/Vehicle Fires
- 227.2%Other
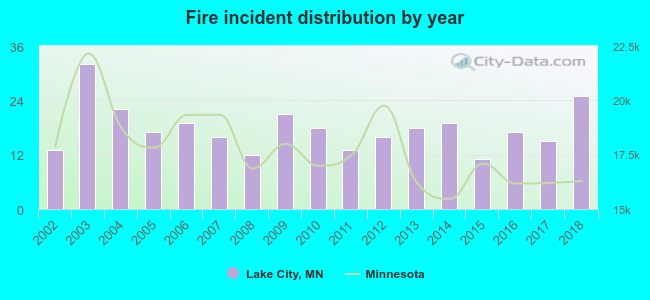 Based on the data from the years 2002 - 2018 the average number of fires per year is 18. The highest number of reported fires - 32 took place in 2003, and the least - 11 in 2015. The data has an increasing trend.
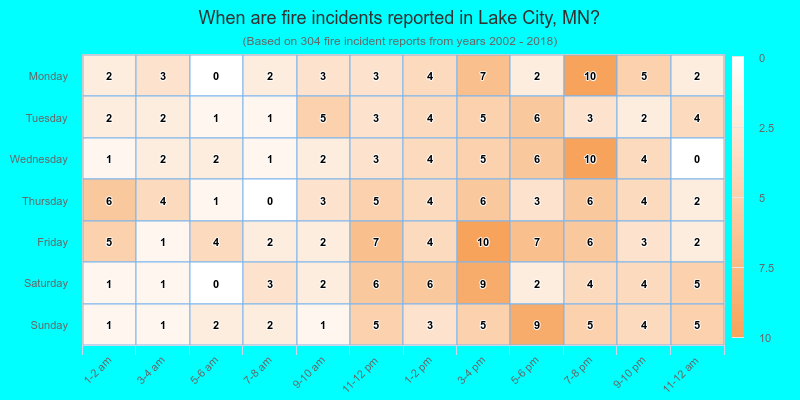
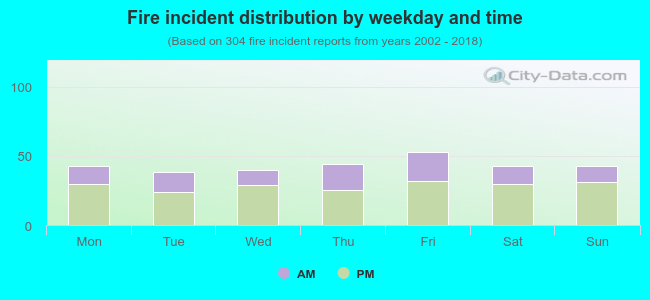 33.9% incidents where reported in the morning and 66.1% in the evening. The most fires (17.4%) took place on Friday, and the least (12.5%) on Tuesday.
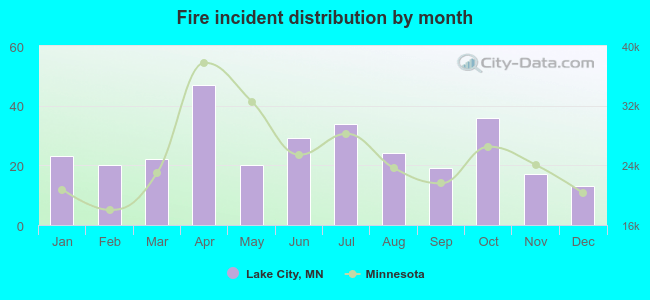 According to the 304 fire incident reports from years 2002 - 2018 most fires (15.5%) took place during April, and the least (4.3%) in December.
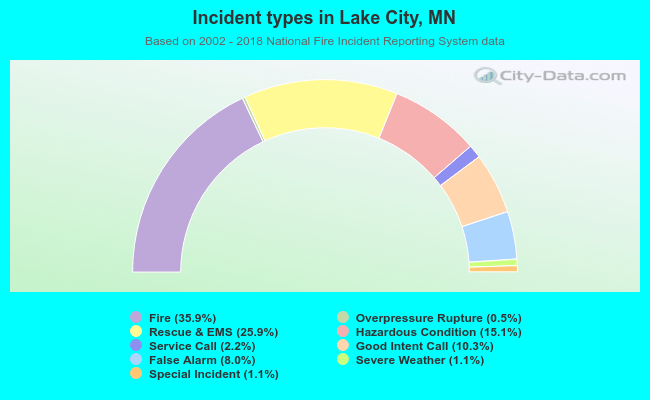 Out of all 847 cases reported during the years 2002 - 2018, the most belonged to the categories: Fire (35.9%), Rescue & EMS (25.9%), and Hazardous Condition (15.1%).
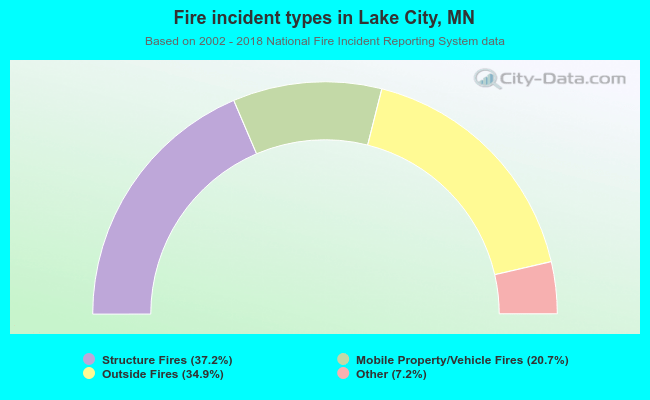 When looking into fire subcategories, the most incidents belonged to: Structure Fires (37.2%), and Outside Fires (34.9%).