Lake Forest: Fire Incidents, Illinois (IL)
Where are fire incidents reported in Lake Forest, IL
Something went wrong! Please refresh the page.
| Fire incidents reported | |
|---|---|
| Sreet name | Count |
| DEERPATH | 148 |
| RIVERWOODS BLVD | 88 |
| SHERIDAN RD | 80 |
| WAUKEGAN RD | 72 |
| WESTERN AVE | 62 |
| ILLINOIS RD | 40 |
| GREEN BAY RD | 32 |
| RIDGE RD | 32 |
| CASCADE CT | 30 |
| OASIS SERVICE RD | 30 |
| WESTMORELAND RD | 28 |
| TELEGRAPH RD | 26 |
| LAKE RD | 24 |
| WESTLEIGH RD | 24 |
| FIELD DR | 22 |
| GREENBAY RD | 22 |
| BRADLEY RD | 20 |
| I 94 | 20 |
| KESWICK LN | 18 |
| MAYFLOWER RD | 18 |
| BEVERLY PL | 16 |
| I-94 (NB) EXPY | 16 |
| I94WB EXPY | 16 |
| LAUREL AVE | 16 |
| RT 41 | 16 |
| WASHINGTON RD | 16 |
| WAVELAND RD | 16 |
| BALLARD DR | 14 |
| KENNEDY RD | 14 |
| OLD ELM RD | 14 |
| Other | 167 |
2002 - 2018 National Fire Incident Reporting System (NFIRS) incidents
- Incident types reported to NFIRS in Lake Forest, IL
- 7,89342.3%Rescue & EMS
- 4,63724.9%False Alarm
- 2,07311.1%Hazardous Condition
- 1,7069.1%Service Call
- 1,1576.2%Fire
- 1,0675.7%Good Intent Call
- 780.4%Special Incident
- 240.1%Overpressure Rupture
- 230.1%Severe Weather
- Fire incident types reported to NFIRS in Lake Forest, IL
- 61653.2%Structure Fires
- 24120.8%Outside Fires
- 18115.6%Mobile Property/Vehicle Fires
- 11910.3%Other
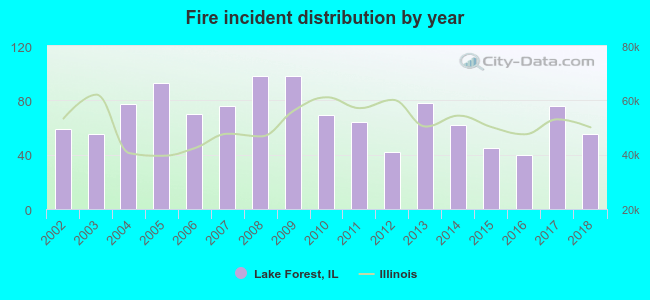 Based on the data from the years 2002 - 2018 the average number of fires per year is 68. The highest number of fires - 98 took place in 2008, and the least - 40 in 2016. The data has a dropping trend.
The average number of yearly fire incidents per 10k residents in Lake Forest, IL compared to nearest cities:
(Note: Based on data for the last 3 years, including only cities with population 5,000 and above)
| Lake Forest: | 29.4 |
| Highwood: | 11.8 |
| Lake Bluff: | 55.0 |
| Highland Park: | 14.4 |
| Lincolnshire: | 47.1 |
| Deerfield: | 26.5 |
| Vernon Hills: | 18.4 |
| North Chicago: | 29.5 |
| Libertyville: | 43.1 |
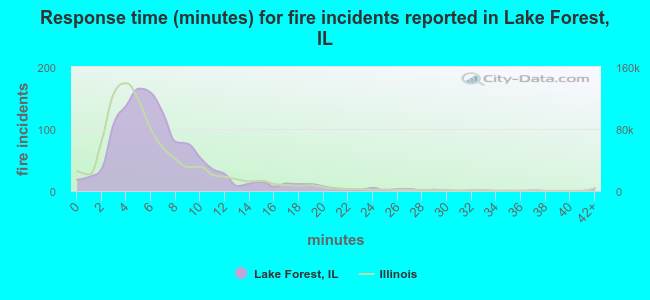 The median response time based on all reported fire incidents is 6 minutes. This is similar to the Illinois median value.
The median response time in Lake Forest, IL compared to nearest cities:
(Note: Based on data for all years, including only cities with at least 500 fire incidents)
| Lake Forest: | 6 minutes |
| Lake Bluff: | 5 minutes |
| Highland Park: | 4 minutes |
| Lincolnshire: | 4 minutes |
| Deerfield: | 5 minutes |
| Vernon Hills: | 5 minutes |
| North Chicago: | 3 minutes |
| Libertyville: | 5 minutes |
| Northbrook: | 5 minutes |
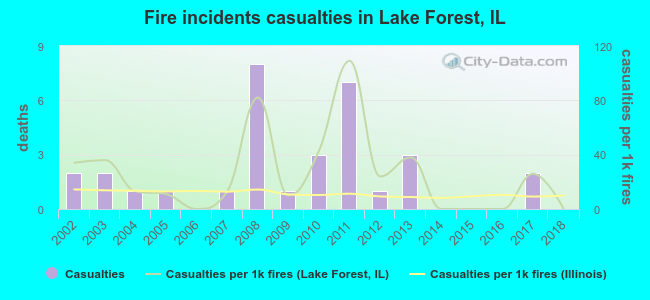 According to the reports from the years 2002 - 2018 the average number of fire-related casualties per year is 2. The highest number of casualties - 8 took place in 2008, and the lowest - 0 in 2006. The data has a dropping trend.
The average number of casualties per 1,000 fires is 26. This indicator was the highest - 109 in 2011, and the lowest 0 in 2006. The trend for injuries per 1,000 fire incidents is declining. Compared to the Illinois value the number of injuries per 1,000 incidents is much higher.
According to the reports from the years 2002 - 2018 the average number of fire-related casualties per year is 2. The highest number of casualties - 8 took place in 2008, and the lowest - 0 in 2006. The data has a dropping trend.
The average number of casualties per 1,000 fires is 26. This indicator was the highest - 109 in 2011, and the lowest 0 in 2006. The trend for injuries per 1,000 fire incidents is declining. Compared to the Illinois value the number of injuries per 1,000 incidents is much higher.Casualties per 1,000 incidents in Lake Forest, IL compared to nearest cities:
(Note: Based on data for all years, including only cities with at least 500 fire incidents)
| Lake Forest: | 27.7 |
| Lake Bluff: | 9.5 |
| Highland Park: | 15.8 |
| Lincolnshire: | 8.4 |
| Deerfield: | 16.6 |
| Vernon Hills: | 25.7 |
| North Chicago: | 6.9 |
| Libertyville: | 4.3 |
| Northbrook: | 17.2 |
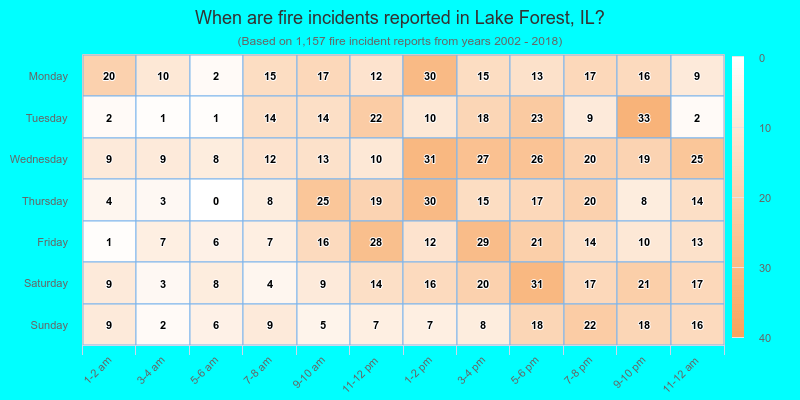
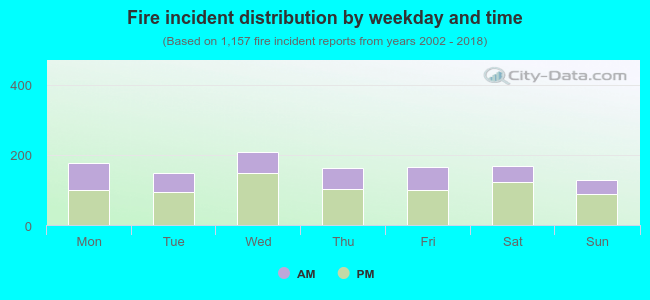 34.6% incidents where reported in the morning and 65.4% in the evening. The most fires (18.1%) took place on Wednesday, and the least (11.0%) on Sunday.
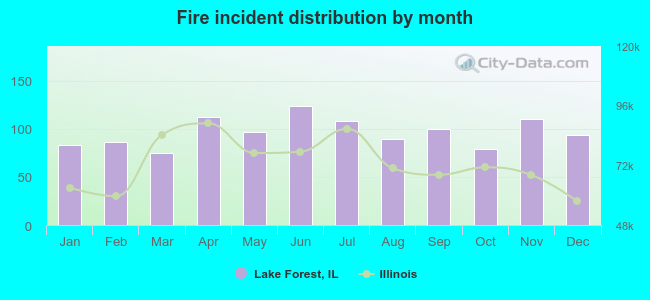 Based on the 1,157 fire incident reports from years 2002 - 2018 most fires (10.7%) took place during June, and the least (6.5%) in March.
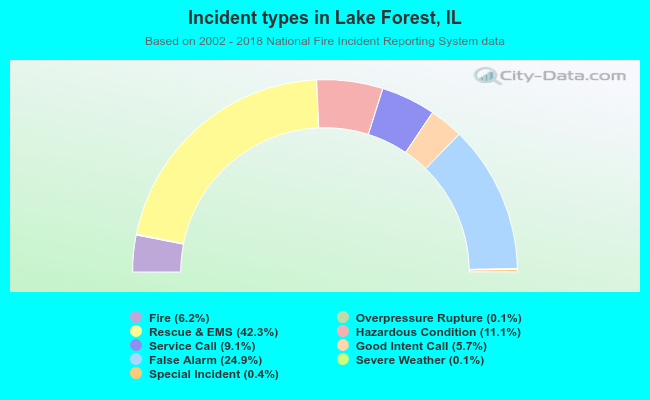 Out of all 18,658 cases reported during the years 2002 - 2018, the most belonged to the categories: Rescue & EMS (42.3%), False Alarm (24.9%), and Hazardous Condition (11.1%).
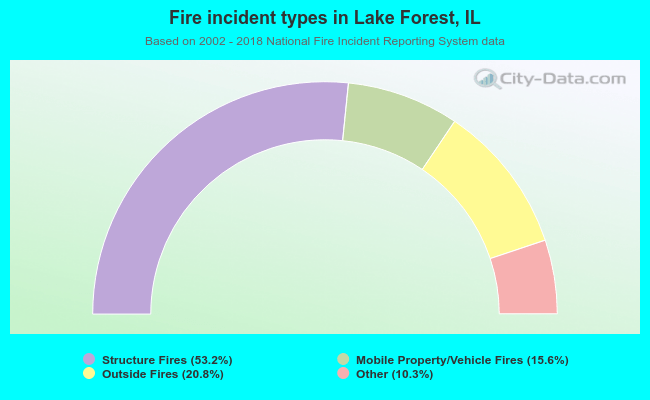 When looking into fire subcategories, the most incidents belonged to: Structure Fires (53.2%), and Outside Fires (20.8%).