Lakewood: Fire Incidents, California (CA)
Where are fire incidents reported in Lakewood, CA
Something went wrong! Please refresh the page.
|
| |||||||||||||||||||||||||||||||||||||||||||||||||||||||||||||||||||||||||||||||||||||||||||||||||||||||||||||
2005 - 2018 National Fire Incident Reporting System (NFIRS) incidents
- Incident types reported to NFIRS in Lakewood, CA
- 17,68171.9%Rescue & EMS
- 2,74211.1%Good Intent Call
- 1,6816.8%False Alarm
- 9734.0%Fire
- 7853.2%Hazardous Condition
- 6852.8%Service Call
- 280.1%Overpressure Rupture
- Fire incident types reported to NFIRS in Lakewood, CA
- 39440.5%Outside Fires
- 31932.8%Structure Fires
- 18519.0%Mobile Property/Vehicle Fires
- 757.7%Other
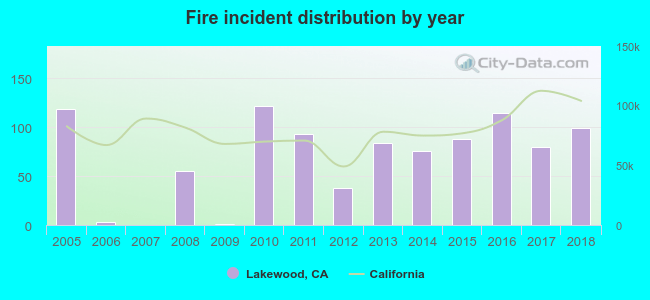 According to the data from the years 2005 - 2018 the average number of fires per year is 70. The highest number of fire incidents - 122 took place in 2010, and the least - 0 in 2007. The data has a declining trend.
The average number of yearly fire incidents per 10k residents in Lakewood, CA compared to nearest cities:
(Note: Based on data for the last 3 years, including only cities with population 5,000 and above)
| Lakewood: | 12.0 |
| Artesia: | 14.4 |
| Bellflower: | 19.1 |
| Hawaiian Gardens: | 20.8 |
| Cerritos: | 14.6 |
| Long Beach: | 22.3 |
| Signal Hill: | 32.1 |
| La Palma: | 7.8 |
| Los Alamitos: | 16.2 |
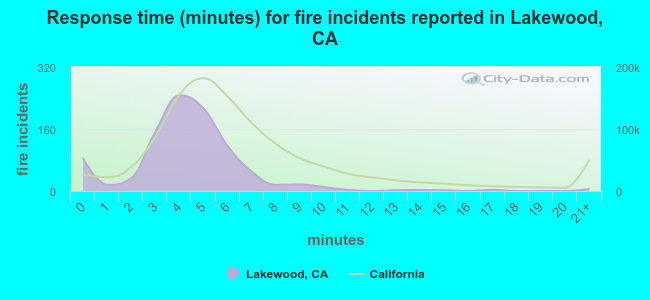 The median response time based on all reported fire incidents is 4 minutes. This is lower compared to the California median value.
The median response time in Lakewood, CA compared to nearest cities:
(Note: Based on data for all years, including only cities with at least 500 fire incidents)
| Lakewood: | 4 minutes |
| Bellflower: | 4 minutes |
| Cerritos: | 5 minutes |
| Long Beach: | 5 minutes |
| Paramount: | 5 minutes |
| Norwalk: | 5 minutes |
| Cypress: | 5 minutes |
| Downey: | 7 minutes |
| Seal Beach: | 5 minutes |
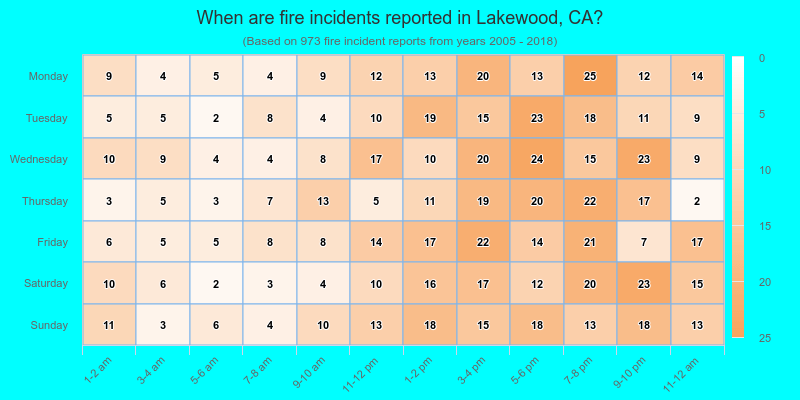
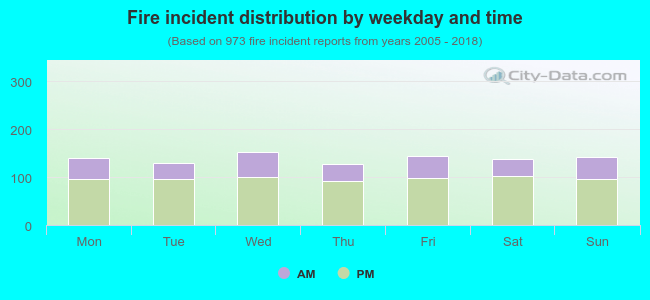 30.1% incidents where reported in the morning and 69.9% in the evening. The most fires (15.7%) took place on Wednesday, and the least (13.1%) on Thursday.
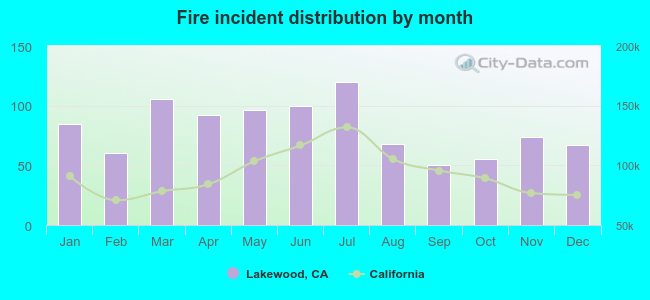 Based on the 973 fires from years 2005 - 2018 most fires (12.3%) took place during July, and the least (5.1%) in September.
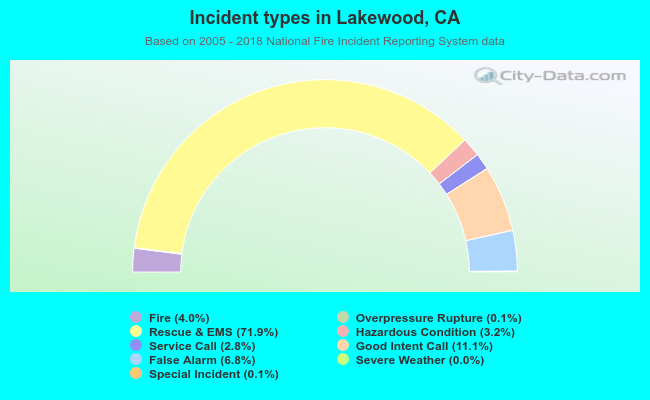 Out of all 24,600 cases reported during the years 2005 - 2018, the most belonged to the categories: Rescue & EMS (71.9%), Good Intent Call (11.1%), and False Alarm (6.8%).
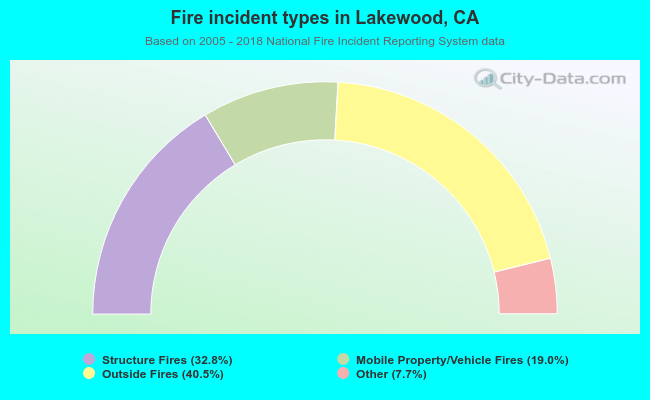 When looking into fire subcategories, the most incidents belonged to: Outside Fires (40.5%), and Structure Fires (32.8%).