Las Cruces: Fire Incidents, New Mexico (NM)
Where are fire incidents reported in Las Cruces, NM
Something went wrong! Please refresh the page.
| Fire incidents reported | |
|---|---|
| Sreet name | Count |
| INTERSTATE 10 | 150 |
| MAIN ST | 148 |
| PICACHO AVE | 142 |
| VALLEY DR | 104 |
| EL PASEO RD | 96 |
| TELSHOR BLVD | 96 |
| AMADOR AVE | 88 |
| SOLANO DR | 88 |
| LOHMAN AVE | 86 |
| MADRID AVE | 76 |
| UNIVERSITY AVE | 62 |
| ESPINA ST | 60 |
| INTERSTATE 25 | 58 |
| FOSTER RD | 54 |
| HADLEY AVE | 52 |
| LA FONDA DR | 52 |
| UNION AVE | 52 |
| IDAHO AVE | 50 |
| HIGHWAY 70 | 48 |
| MOTEL BLVD | 42 |
| MESQUITE ST | 38 |
| NEVADA AVE | 38 |
| EL CAMINO REAL | 34 |
| BOUTZ RD | 32 |
| CARVER RD | 32 |
| MISSOURI AVE | 32 |
| TRIVIZ DR | 32 |
| BATAAN MEMORIAL WEST | 30 |
| HIGHWAY 28 | 30 |
| STERN DR | 30 |
| Other | 1,278 |
2007 - 2018 National Fire Incident Reporting System (NFIRS) incidents
- Incident types reported to NFIRS in Las Cruces, NM
- 43,40261.1%Rescue & EMS
- 13,03518.4%Good Intent Call
- 6,6529.4%Service Call
- 3,2104.5%Fire
- 2,4993.5%False Alarm
- 1,8742.6%Hazardous Condition
- 2170.3%Special Incident
- Fire incident types reported to NFIRS in Las Cruces, NM
- 1,84857.6%Outside Fires
- 75823.6%Structure Fires
- 42313.2%Mobile Property/Vehicle Fires
- 1815.6%Other
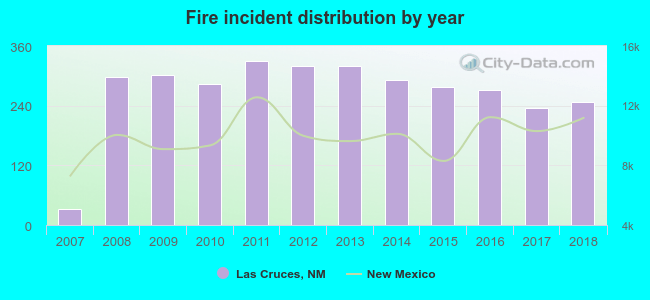 Based on the data from the years 2007 - 2018 the average number of fires per year is 267. The highest number of fire incidents - 330 took place in 2011, and the least - 32 in 2007. The data has a growing trend.
The average number of yearly fire incidents per 10k residents in Las Cruces, NM compared to nearest cities:
(Note: Based on data for the last 3 years, including only cities with population 5,000 and above)
| Las Cruces: | 24.8 |
| Fairacres: | 59.4 |
| Anthony: | 60.5 |
| Chaparral: | 92.3 |
| Sunland Park: | 25.5 |
| Deming: | 84.9 |
| Alamogordo: | 39.8 |
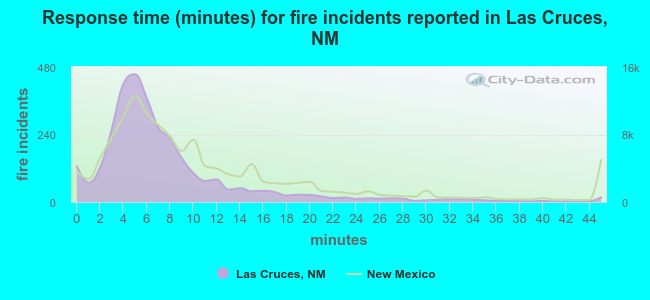 The median response time based on all reported fire incidents is 6 minutes. This is lower compared to the New Mexico median value.
The median response time in Las Cruces, NM compared to nearest cities:
(Note: Based on data for all years, including only cities with at least 500 fire incidents)
| Las Cruces: | 6 minutes |
| Anthony: | 12 minutes |
| Chaparral: | 8 minutes |
| Deming: | 7 minutes |
| Alamogordo: | 5 minutes |
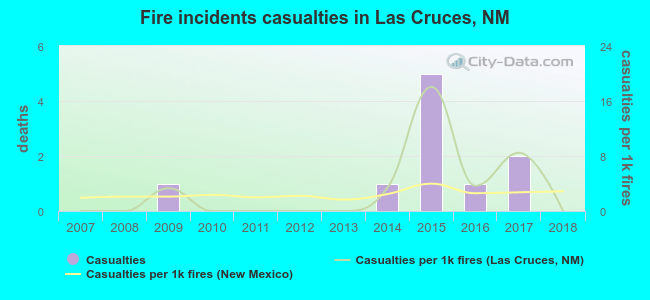 According to the reports from the years 2007 - 2018 the average number of fire-related casualties per year is 1. The highest number of casualties - 5 took place in 2015, and the lowest - 0 in 2007. The data has a constant trend.
The average number of injuries per 1,000 fires is 3. This indicator was the highest - 18 in 2015, and the lowest 0 in 2007. The trend for injuries per 1,000 fires is dropping. Compared to the New Mexico value the number of injuries per 1,000 fires is higher.
According to the reports from the years 2007 - 2018 the average number of fire-related casualties per year is 1. The highest number of casualties - 5 took place in 2015, and the lowest - 0 in 2007. The data has a constant trend.
The average number of injuries per 1,000 fires is 3. This indicator was the highest - 18 in 2015, and the lowest 0 in 2007. The trend for injuries per 1,000 fires is dropping. Compared to the New Mexico value the number of injuries per 1,000 fires is higher.Casualties per 1,000 incidents in Las Cruces, NM compared to nearest cities:
(Note: Based on data for all years, including only cities with at least 500 fire incidents)
| Las Cruces: | 3.1 |
| Anthony: | 0.0 |
| Chaparral: | 0.0 |
| Deming: | 3.0 |
| Alamogordo: | 4.9 |
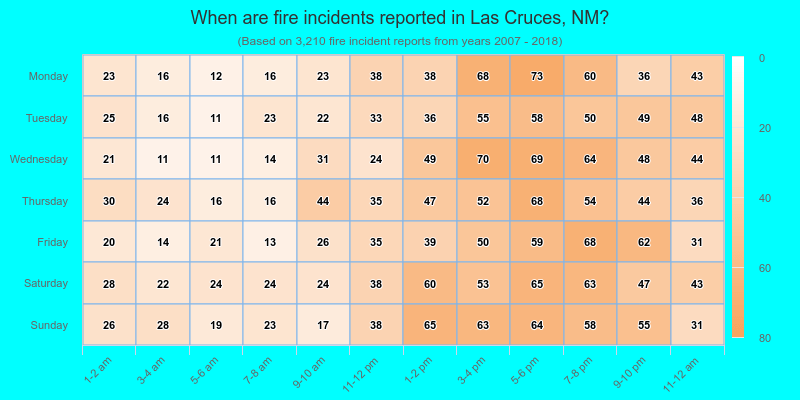
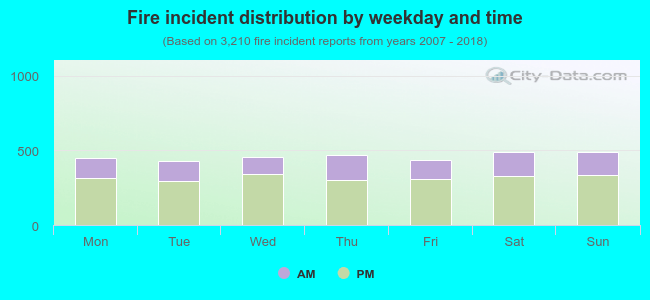 30.4% incidents where reported in the morning and 69.6% in the evening. The most fires (15.3%) took place on Saturday, and the least (13.3%) on Tuesday.
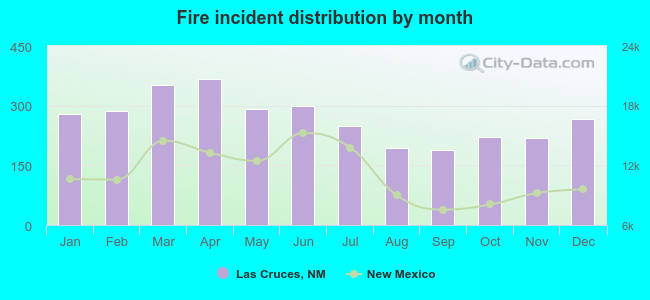 According to the 3,210 incident reports from years 2007 - 2018 most fires (11.4%) took place during April, and the least (5.9%) in September.
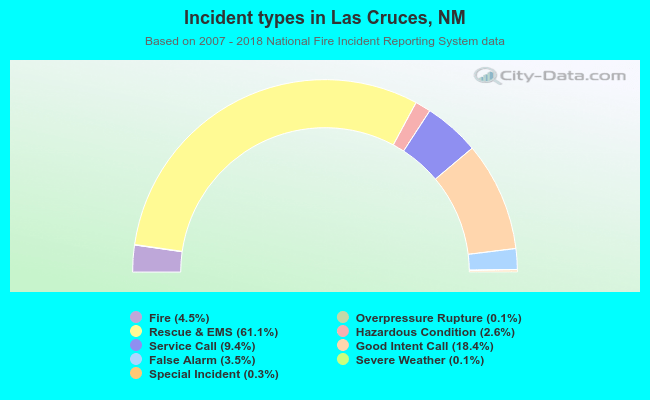 Out of all 70,979 cases reported during the years 2007 - 2018, the most belonged to the categories: Rescue & EMS (61.1%), Good Intent Call (18.4%), and Service Call (9.4%).
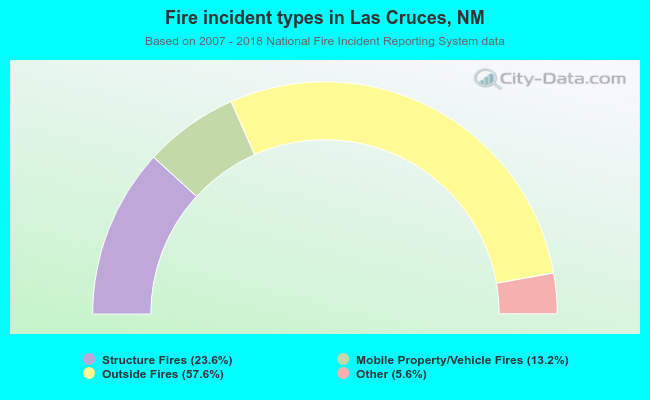 When looking into fire subcategories, the most incidents belonged to: Outside Fires (57.6%), and Structure Fires (23.6%).