Lawrenceburg: Fire Incidents, Kentucky (KY)
Where are fire incidents reported in Lawrenceburg, KY
Something went wrong! Please refresh the page.
|
| |||||||||||||||||||||||||||||||||||||||||||||||||||||||||||||||||||||||||||||||||||||||||||||||||||||||||||||
2003 - 2018 National Fire Incident Reporting System (NFIRS) incidents
- Incident types reported to NFIRS in Lawrenceburg, KY
- 36836.8%Fire
- 30330.3%Rescue & EMS
- 11611.6%Good Intent Call
- 939.3%False Alarm
- 646.4%Hazardous Condition
- 383.8%Service Call
- 121.2%Severe Weather
- 30.3%Special Incident
- 20.2%Overpressure Rupture
- Fire incident types reported to NFIRS in Lawrenceburg, KY
- 17748.1%Structure Fires
- 8924.2%Mobile Property/Vehicle Fires
- 8623.4%Outside Fires
- 164.3%Other
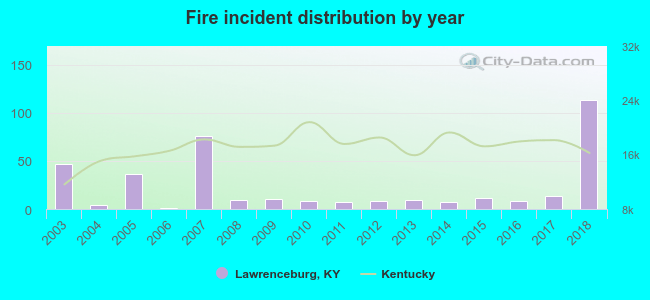 According to the data from the years 2003 - 2018 the average number of fire incidents per year is 23. The highest number of reported fires - 113 took place in 2018, and the least - 1 in 2006. The data has a rising trend.
The average number of yearly fire incidents per 10k residents in Lawrenceburg, KY compared to nearest cities:
(Note: Based on data for the last 3 years, including only cities with population 5,000 and above)
| Lawrenceburg: | 40.6 |
| Versailles: | 83.2 |
| Frankfort: | 53.7 |
| Wilmore: | 12.5 |
| Harrodsburg: | 106.4 |
| Nicholasville: | 62.1 |
| Shelbyville: | 82.3 |
| Georgetown: | 39.4 |
| Danville: | 54.6 |
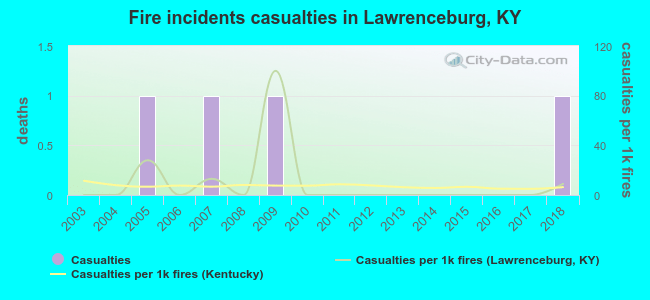 According to the data from the years 2003 - 2018 the average number of fire-related yearly casualties is 0. The highest number of injuries - 1 took place in 2005, and the lowest - 0 in 2003. The data has a growing trend.
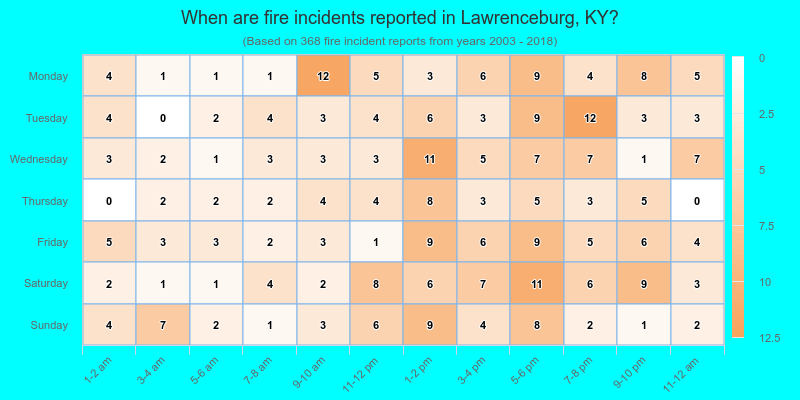
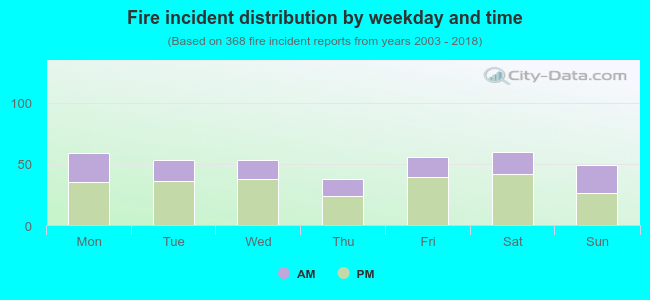 34.8% incidents where reported in the morning and 65.2% in the evening. The most fires (16.3%) took place on Saturday, and the least (10.3%) on Thursday.
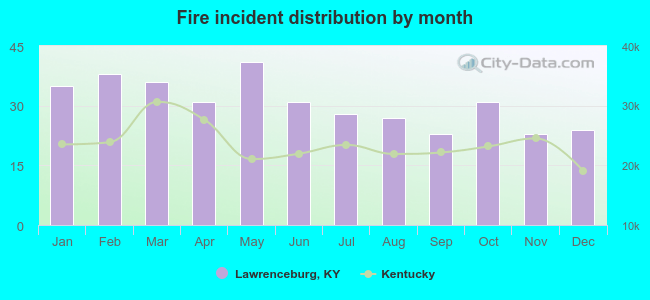 According to the 368 reports from years 2003 - 2018 most fires (11.1%) took place during May, and the least (6.3%) in September.
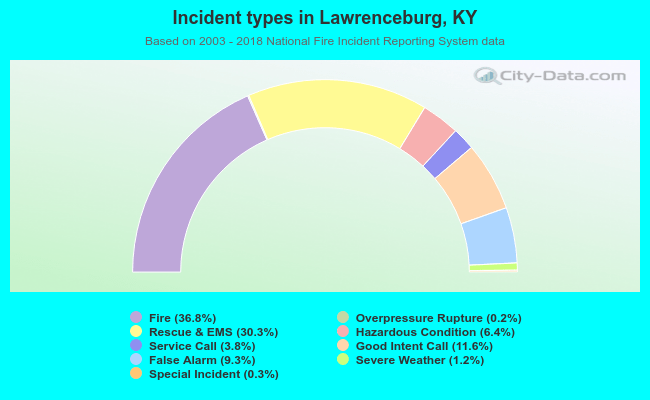 Out of all 999 cases reported during the years 2003 - 2018, the most belonged to the categories: Fire (36.8%), Rescue & EMS (30.3%), and Good Intent Call (11.6%).
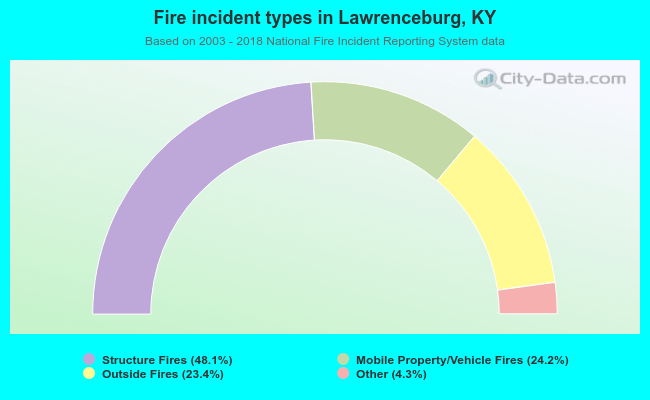 When looking into fire subcategories, the most incidents belonged to: Structure Fires (48.1%), and Mobile Property/Vehicle Fires (24.2%).