Lemay: Fire Incidents, Missouri (MO)
Where are fire incidents reported in Lemay, MO
Something went wrong! Please refresh the page.
| Fire incidents reported | |
|---|---|
| Sreet name | Count |
| LEMAY FERRY RD | 52 |
| BAYLESS AVE | 48 |
| TELEGRAPH RD | 34 |
| HOFFMEISTER AVE | 30 |
| WACHTEL AVE | 30 |
| KINGSTON DR | 24 |
| ORIENT AVE | 22 |
| S. BROADWAY | 22 |
| BROADWAY | 20 |
| FANNIE AVE | 20 |
| GENTRY AVE | 20 |
| INTERSTATE 55 | 20 |
| ERSKINE AVE | 16 |
| REGINA AVE | 16 |
| UNION RD | 16 |
| WEBER RD | 16 |
| WEISS AVE | 16 |
| KAYSER AVE | 14 |
| LUNA AVE | 14 |
| REAVIS BARRACKS | 14 |
| RIPA AVE | 14 |
| WALLER AVE | 14 |
| DAMMERT AVE | 12 |
| HORN AVE | 12 |
| PARDELLA AVE | 12 |
| RIVER CITY CASINO BLVD | 12 |
| TUCKAHOE DR | 12 |
| ARLEE AVE | 10 |
| E. ARLEE | 10 |
| E. RIPA | 10 |
| Other | 156 |
2002 - 2018 National Fire Incident Reporting System (NFIRS) incidents
- Incident types reported to NFIRS in Lemay, MO
- 2,06250.9%Rescue & EMS
- 73818.2%Fire
- 50312.4%Hazardous Condition
- 3759.3%Good Intent Call
- 1904.7%Service Call
- 1553.8%False Alarm
- 180.4%Special Incident
- 70.2%Overpressure Rupture
- Fire incident types reported to NFIRS in Lemay, MO
- 43859.3%Structure Fires
- 20127.2%Outside Fires
- 699.3%Mobile Property/Vehicle Fires
- 304.1%Other
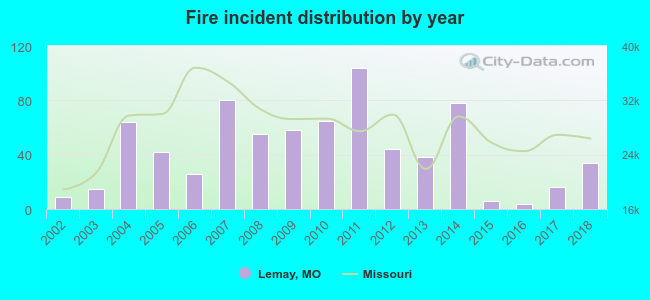 According to the data from the years 2002 - 2018 the average number of fires per year is 43. The highest number of fire incidents - 104 took place in 2011, and the least - 4 in 2016. The data has an increasing trend.
The average number of yearly fire incidents per 10k residents in Lemay, MO compared to nearest cities:
(Note: Based on data for the last 3 years, including only cities with population 5,000 and above)
| Lemay: | 10.8 |
| Affton: | 8.9 |
| Mehlville: | 1.2 |
| Shrewsbury: | 28.5 |
| Crestwood: | 22.6 |
| Webster Groves: | 24.9 |
| Oakville: | 0.3 |
| Maplewood: | 75.0 |
| Sunset Hills: | 39.5 |
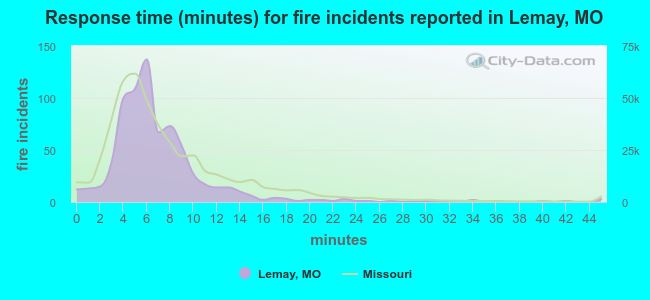 The median response time based on all reported fire incidents is 6 minutes. This is close to the state median value.
The median response time in Lemay, MO compared to nearest cities:
(Note: Based on data for all years, including only cities with at least 500 fire incidents)
| Lemay: | 6 minutes |
| Affton: | 5 minutes |
| Dupo: | 5 minutes |
| Shrewsbury: | 5 minutes |
| Crestwood: | 4 minutes |
| Webster Groves: | 5 minutes |
| Maplewood: | 4 minutes |
| Sunset Hills: | 5 minutes |
| Cahokia: | 7 minutes |
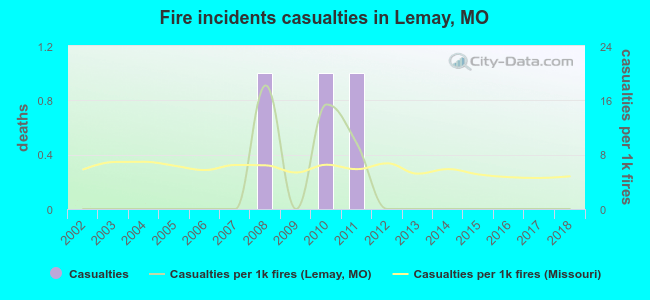 Based on the reports from the years 2002 - 2018 the average number of fire-related casualties per year is 0. The highest number of casualties - 1 took place in 2008, and the lowest - 0 in 2002. The data has a constant trend.
The average number of casualties per 1,000 fires is 3. This indicator was the highest - 18 in 2008, and the lowest 0 in 2002. The trend for casualties per 1,000 fire incidents is constant. Compared to the state value the number of casualties per 1,000 fire incidents is lower.
Based on the reports from the years 2002 - 2018 the average number of fire-related casualties per year is 0. The highest number of casualties - 1 took place in 2008, and the lowest - 0 in 2002. The data has a constant trend.
The average number of casualties per 1,000 fires is 3. This indicator was the highest - 18 in 2008, and the lowest 0 in 2002. The trend for casualties per 1,000 fire incidents is constant. Compared to the state value the number of casualties per 1,000 fire incidents is lower.Casualties per 1,000 incidents in Lemay, MO compared to nearest cities:
(Note: Based on data for all years, including only cities with at least 500 fire incidents)
| Lemay: | 4.1 |
| Affton: | 1.1 |
| Dupo: | 6.0 |
| Shrewsbury: | 5.7 |
| Crestwood: | 27.4 |
| Webster Groves: | 1.2 |
| Maplewood: | 13.3 |
| Sunset Hills: | 3.4 |
| Cahokia: | 9.4 |
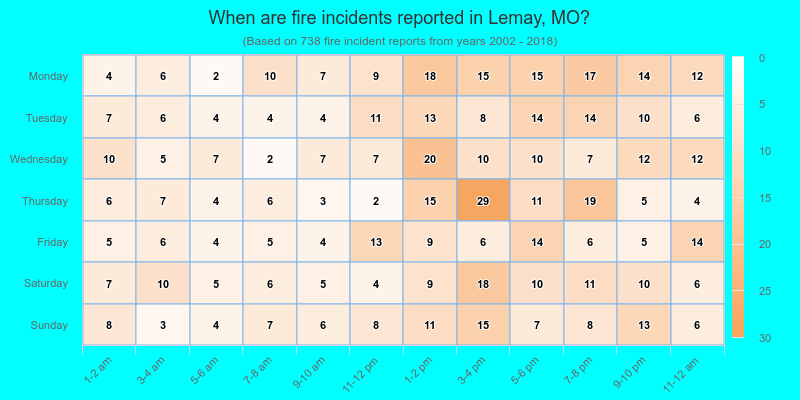
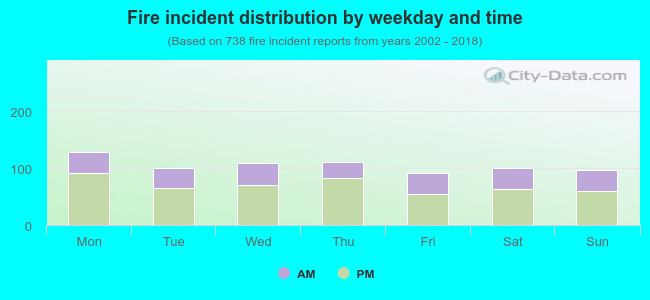 33.9% incidents where reported in the morning and 66.1% in the evening. The most fires (17.5%) took place on Monday, and the least (12.3%) on Friday.
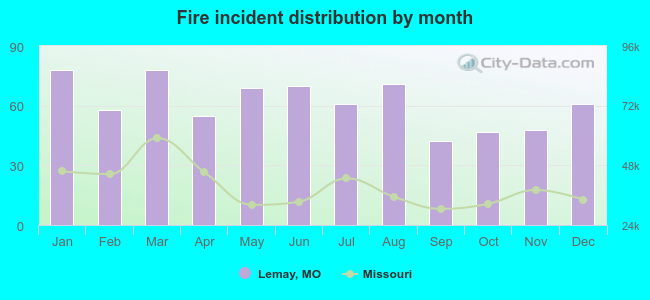 According to the 738 reports from years 2002 - 2018 most fires (10.6%) took place during January, and the least (5.7%) in September.
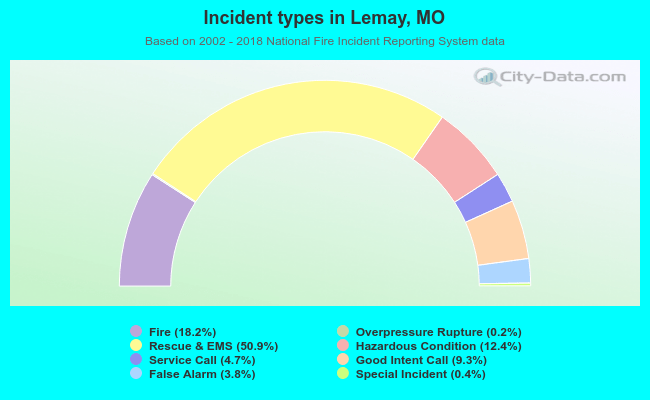 Out of all 4,048 cases reported during the years 2002 - 2018, the most belonged to the categories: Rescue & EMS (50.9%), Fire (18.2%), and Hazardous Condition (12.4%).
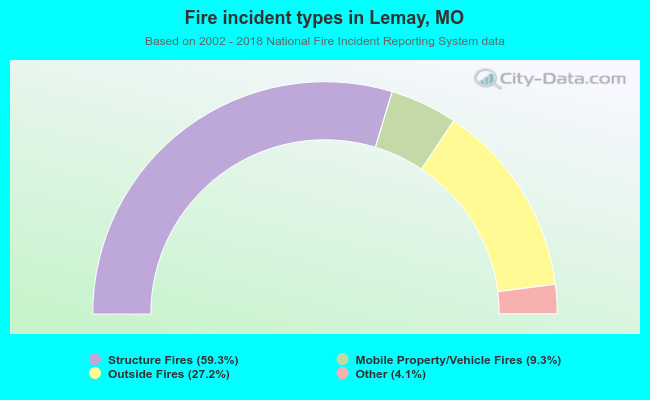 When looking into fire subcategories, the most reports belonged to: Structure Fires (59.3%), and Outside Fires (27.2%).