Leonia: Fire Incidents, New Jersey (NJ)
Where are fire incidents reported in Leonia, NJ
Something went wrong! Please refresh the page.
|
| |||||||||||||||||||||||||||||||||||||||||||||||||||||||||||||||||||||||||||||||||||||||||||||||||||||||||||||
2003 - 2018 National Fire Incident Reporting System (NFIRS) incidents
- Incident types reported to NFIRS in Leonia, NJ
- 1,13442.8%Hazardous Condition
- 73527.7%Fire
- 47217.8%False Alarm
- 1696.4%Good Intent Call
- 1144.3%Service Call
- 180.7%Rescue & EMS
- 80.3%Overpressure Rupture
- Fire incident types reported to NFIRS in Leonia, NJ
- 61183.1%Structure Fires
- 658.8%Outside Fires
- 537.2%Mobile Property/Vehicle Fires
- 60.8%Other
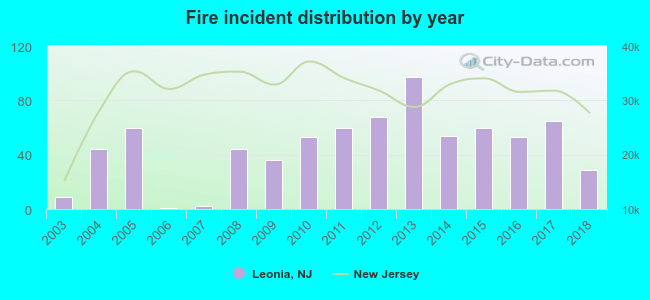 According to the data from the years 2003 - 2018 the average number of fire incidents per year is 46. The highest number of fire incidents - 97 took place in 2013, and the least - 1 in 2006. The data has an increasing trend.
The average number of yearly fire incidents per 10k residents in Leonia, NJ compared to nearest cities:
(Note: Based on data for the last 3 years, including only cities with population 5,000 and above)
| Leonia: | 53.6 |
| Fort Lee: | 43.8 |
| Palisades Park: | 37.8 |
| Ridgefield Park: | 30.3 |
| Englewood: | 88.8 |
| Bogota: | 35.6 |
| Teaneck: | 47.0 |
| Englewood Cliffs: | 18.0 |
| Ridgefield: | 38.7 |
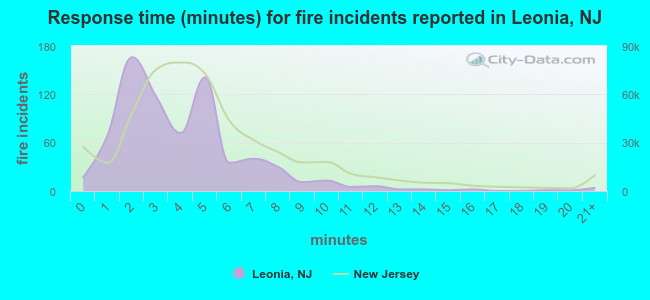 The median response time based on all reported fire incidents is 3 minutes. This is lower compared to the New Jersey median value.
The median response time in Leonia, NJ compared to nearest cities:
(Note: Based on data for all years, including only cities with at least 500 fire incidents)
| Leonia: | 3 minutes |
| Fort Lee: | 4 minutes |
| Palisades Park: | 2 minutes |
| Englewood: | 4 minutes |
| Teaneck: | 3 minutes |
| Ridgefield: | 3 minutes |
| Edgewater: | 3 minutes |
| Cliffside Park: | 5 minutes |
| Hackensack: | 3 minutes |
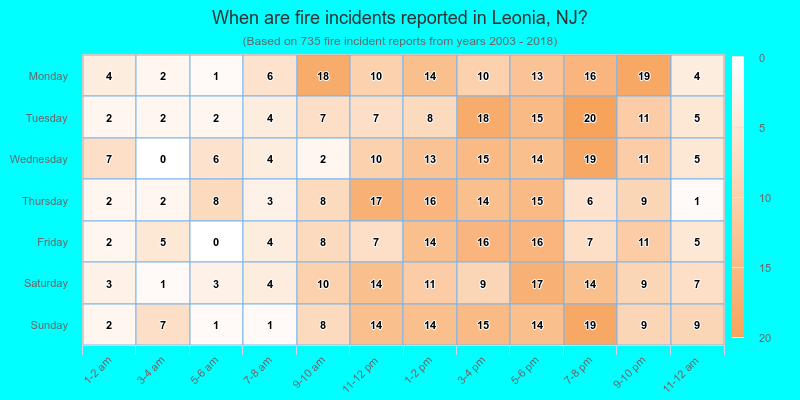
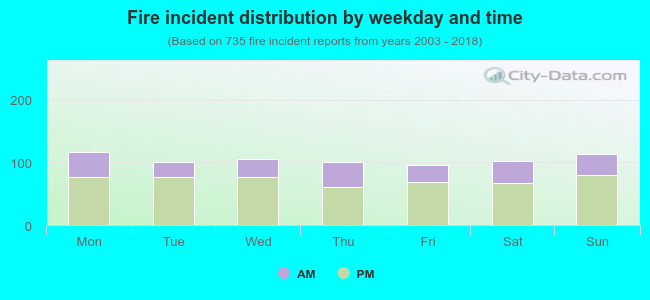 31.0% incidents where reported in the morning and 69.0% in the evening. The most fires (15.9%) took place on Monday, and the least (12.9%) on Friday.
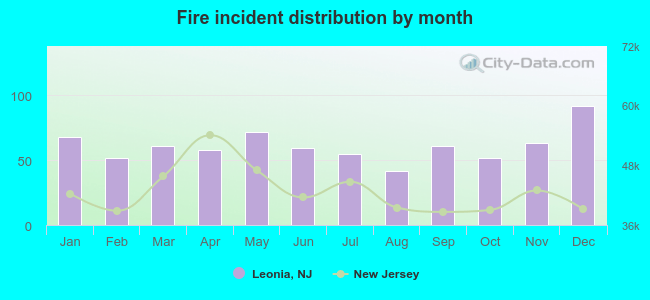 According to the 735 fire incidents from years 2003 - 2018 most fires (12.5%) took place during December, and the least (5.7%) in August.
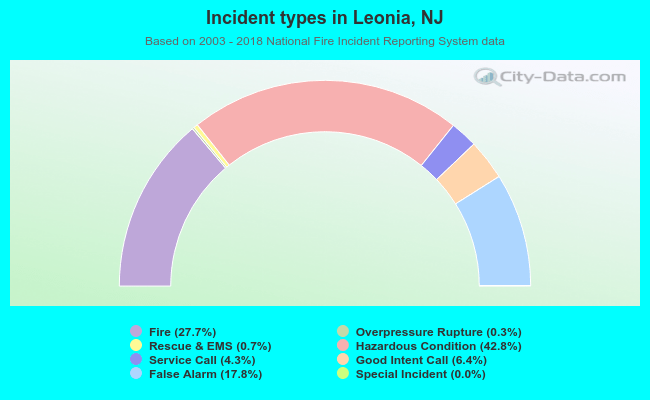 Out of all 2,651 cases reported during the years 2003 - 2018, the most belonged to the categories: Hazardous Condition (42.8%), Fire (27.7%), and False Alarm (17.8%).
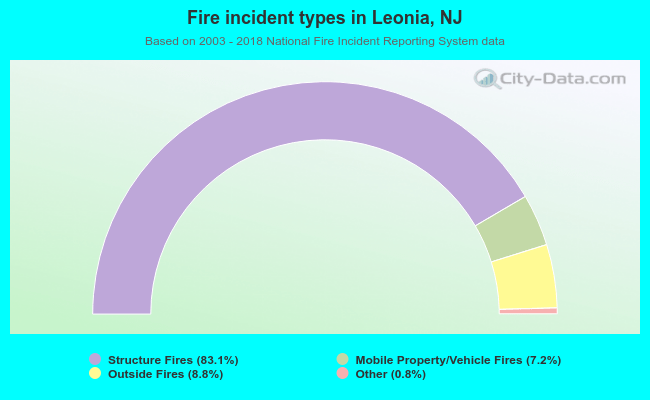 When looking into fire subcategories, the most incidents belonged to: Structure Fires (83.1%), and Outside Fires (8.8%).