| Fire incidents reported |
|---|
| Sreet name | Count |
|---|
| COUNTY ROAD 489 | 16 | | COUNTY RD 612 | 12 | | MARIUS ST | 12 | | BIG ANTLER RD | 10 | | CLINTON DR | 10 | | COUNTY ROAD 491 | 10 | | FLEMING RD | 10 | | MERIDIAN LINE RD | 10 | | SALLING AVE | 10 | | CO RD 489 | 8 | | CO RD 491 | 8 | | COUNTY ROAD 612 | 8 | | CO RD 612 | 6 | | KNEELAND ST | 6 | | RED OAK RD | 6 | | TOWNLINE RD | 6 | | TOWNLINE ROAD | 6 | | AARONS RD | 4 | | AGREN RD | 4 | | AIRPORT RD | 4 | | BUTTLES RD | 4 | | CO RD 491 LGTS | 4 | | CO ROAD 612 | 4 | | COUNTY RD 489 | 4 | | CR 489 RD | 4 |
| | | Fire incidents reported |
|---|
| Sreet name | Count |
|---|
| FARRINGTON RD | 4 | | HILL RD ST | 4 | | JENSON ST | 4 | | KNEELAND STREET | 4 | | LAKEVIEW AVE | 4 | | LAURA DR | 4 | | MARION ST | 4 | | MARIUS | 4 | | MONTMORENCY ST | 4 | | OLD 612 | 4 | | STATE PARK RD | 4 | | VEEDER RD | 4 | | WILLIAMS RD | 4 | | WOODRUFF RD | 4 | | 10160 COUNTY ROAD 612 | 2 | | 1328 OAK LK RD | 2 | | 162 FIRE TOWER RD | 2 | | 1709 CO ROAD 612 | 2 | | 1795 MATHENY TRL | 2 | | 1876 HALBERG ROAD | 2 | | 25 BIG BUCK DR | 2 | | 2875 TOWNLINE ROAD | 2 | | 3010 CLINTON DRIVE | 2 | | 3099 WEST KNEELAND RD | 2 | | |
|
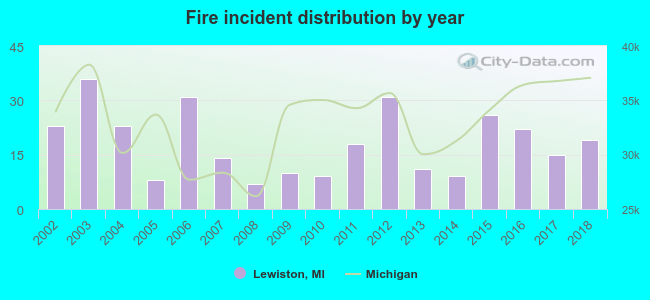 Based on the data from the years 2002 - 2018 the average number of fires per year is 18. The highest number of fire incidents - 36 took place in 2003, and the least - 7 in 2008. The data has a dropping trend.
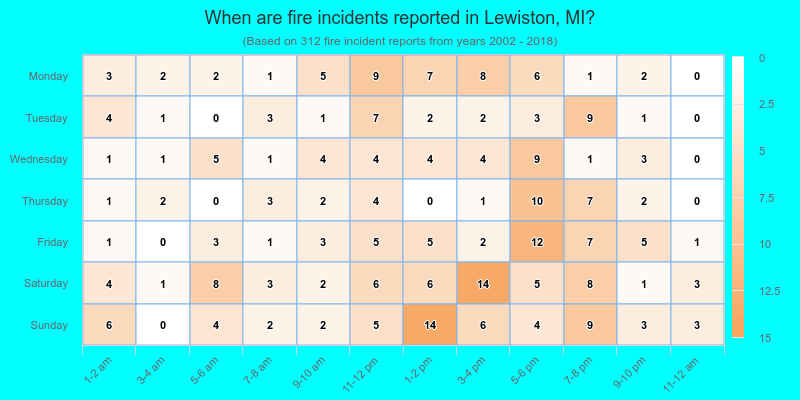
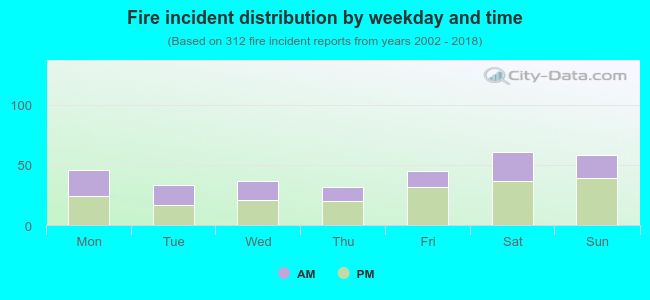 39.1% incidents where reported in the morning and 60.9% in the evening. The most fires (19.6%) took place on Saturday, and the least (10.3%) on Thursday.
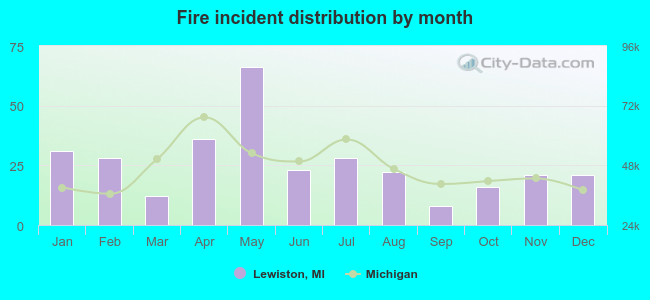 Based on the 312 fire incidents from years 2002 - 2018 most fires (21.2%) took place during May, and the least (2.6%) in September.
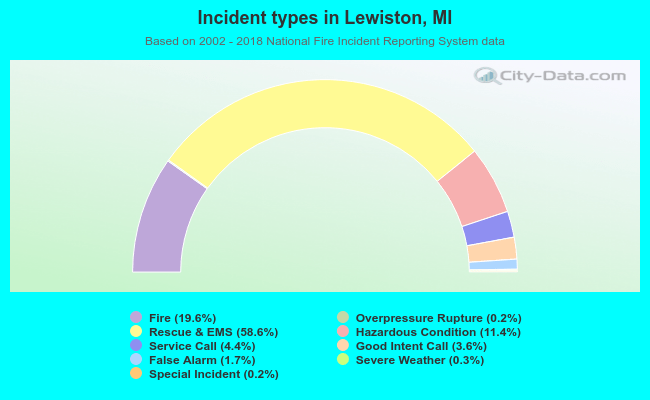 Out of all 1,591 cases reported during the years 2002 - 2018, the most belonged to the categories: Rescue & EMS (58.6%), Fire (19.6%), and Hazardous Condition (11.4%).
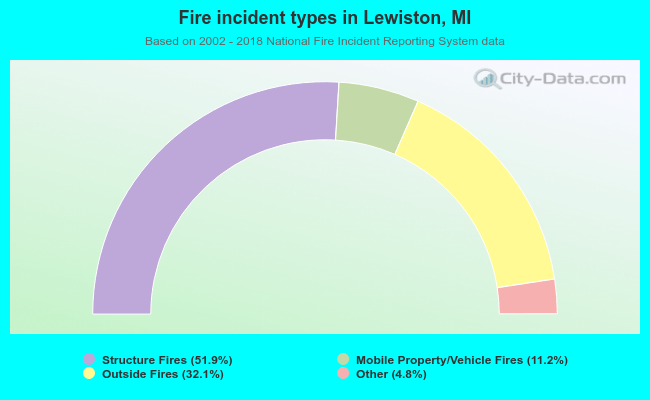 When looking into fire subcategories, the most reports belonged to: Structure Fires (51.9%), and Outside Fires (32.1%).