Lexington: Fire Incidents, Tennessee (TN)
Where are fire incidents reported in Lexington, TN
Something went wrong! Please refresh the page.
| Fire incidents reported | |
|---|---|
| Sreet name | Count |
| CHURCH ST | 154 |
| BROAD ST | 124 |
| MAIN ST | 110 |
| HIGHWAY 412 | 102 |
| HIGHWAY 104 | 86 |
| NATCHEZ TRACE DR | 66 |
| INTERSTATE 40 | 64 |
| HOLLEY ST | 46 |
| HIGHWAY 200 | 38 |
| SPRING ST | 38 |
| HIGHWAY 22 | 36 |
| MCKNIGHT DR | 32 |
| HIGHWAY 22 A | 28 |
| RUSH ST | 28 |
| BIBLE GROVE RD | 26 |
| MOOSE LODGE RD | 20 |
| OLD JACKSON RD | 20 |
| POPE RD | 20 |
| ALBERTON RD | 18 |
| FRANKLIN STORE RD | 18 |
| OLD HUNTINGDON ST | 18 |
| SMITH AVE | 18 |
| AYERS ST | 14 |
| COOK ST | 14 |
| DIXON ST | 14 |
| HIGHWAY 412 | 14 |
| SHADY HILL RD | 14 |
| TIMBERLAKE-WILDERSVILLE RD | 14 |
| 22 HWY | 12 |
| BAILEY ST | 12 |
| Other | 187 |
2005 - 2018 National Fire Incident Reporting System (NFIRS) incidents
- Incident types reported to NFIRS in Lexington, TN
- 1,40537.2%Fire
- 1,06628.2%Hazardous Condition
- 43711.6%Service Call
- 3318.8%Rescue & EMS
- 3118.2%Good Intent Call
- 2165.7%False Alarm
- 60.2%Overpressure Rupture
- 40.1%Special Incident
- Fire incident types reported to NFIRS in Lexington, TN
- 60743.2%Outside Fires
- 51636.7%Structure Fires
- 27419.5%Mobile Property/Vehicle Fires
- 80.6%Other
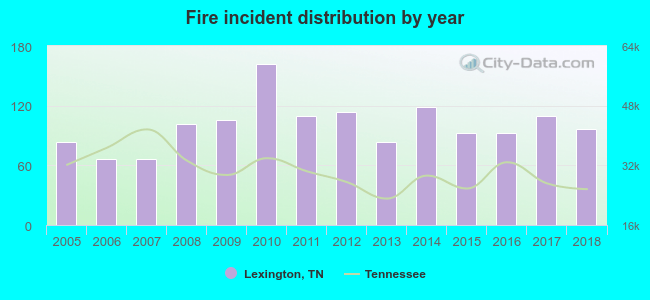 According to the data from the years 2005 - 2018 the average number of fires per year is 100. The highest number of fires - 162 took place in 2010, and the least - 66 in 2006. The data has a growing trend.
The average number of yearly fire incidents per 10k residents in Lexington, TN compared to nearest cities:
(Note: Based on data for the last 3 years, including only cities with population 5,000 and above)
| Lexington: | 127.8 |
| Luray: | 9.1 |
| Henderson: | 103.4 |
| Jackson: | 58.8 |
| Milan: | 106.8 |
| Savannah: | 281.2 |
| Humboldt: | 67.1 |
| McKenzie: | 88.5 |
| Bolivar: | 160.5 |
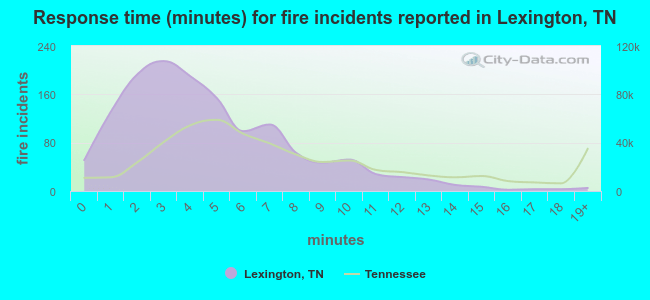 The median response time based on all reported fire incidents is 4 minutes. This is lower compared to the Tennessee median value.
The median response time in Lexington, TN compared to nearest cities:
(Note: Based on data for all years, including only cities with at least 500 fire incidents)
| Lexington: | 4 minutes |
| Parsons: | 6 minutes |
| Henderson: | 6 minutes |
| Jackson: | 6 minutes |
| Huntingdon: | 7 minutes |
| Milan: | 6 minutes |
| Savannah: | 8 minutes |
| Humboldt: | 4 minutes |
| Camden: | 8 minutes |
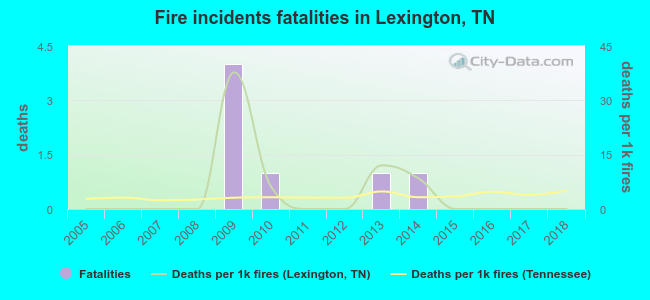 According to the data from the years 2005 - 2018 the average number of fire-related yearly deaths is 1. The highest number of deaths - 4 took place in 2009, and the lowest - 0 in 2005. The data has a constant trend.
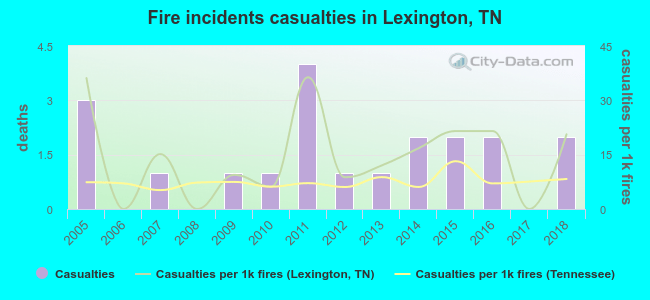 According to the data from the years 2005 - 2018 the average number of fire-related casualties per year is 1. The highest number of reported injuries - 4 took place in 2011, and the lowest - 0 in 2006. The data has a declining trend.
The average number of injuries per 1,000 fire incidents is 15. This indicator was the highest - 36 in 2011, and the lowest 0 in 2006. The trend for injuries per 1,000 incidents is dropping. Compared to the Tennessee value the number of injuries per 1,000 fires is higher.
According to the data from the years 2005 - 2018 the average number of fire-related casualties per year is 1. The highest number of reported injuries - 4 took place in 2011, and the lowest - 0 in 2006. The data has a declining trend.
The average number of injuries per 1,000 fire incidents is 15. This indicator was the highest - 36 in 2011, and the lowest 0 in 2006. The trend for injuries per 1,000 incidents is dropping. Compared to the Tennessee value the number of injuries per 1,000 fires is higher.
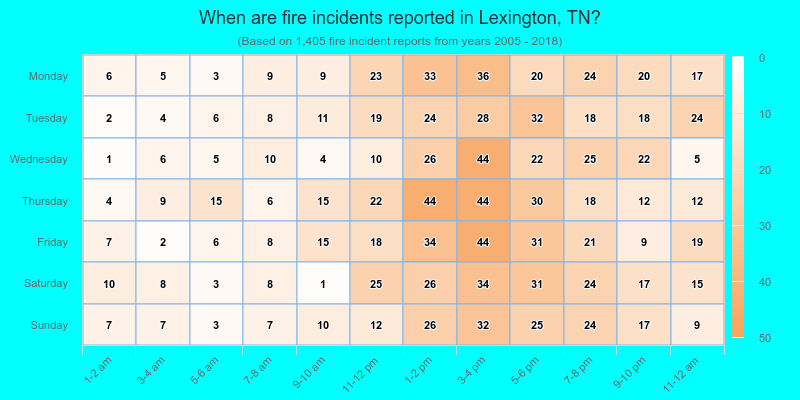
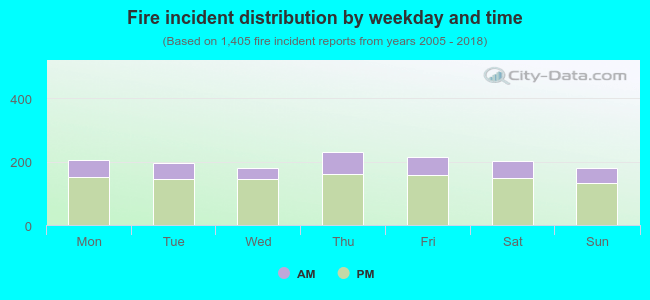 26.3% incidents where reported in the morning and 73.7% in the evening. The most fires (16.4%) took place on Thursday, and the least (12.7%) on Sunday.
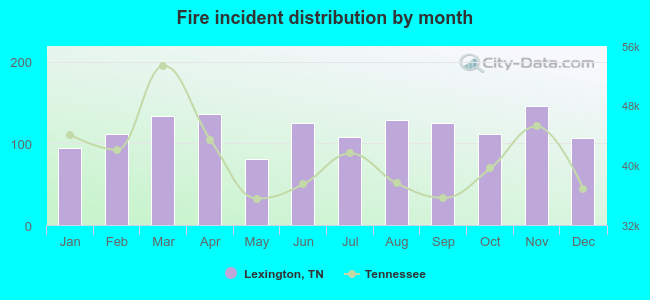 Based on the 1,405 fire incident reports from years 2005 - 2018 most fires (10.4%) took place during November, and the least (5.8%) in May.
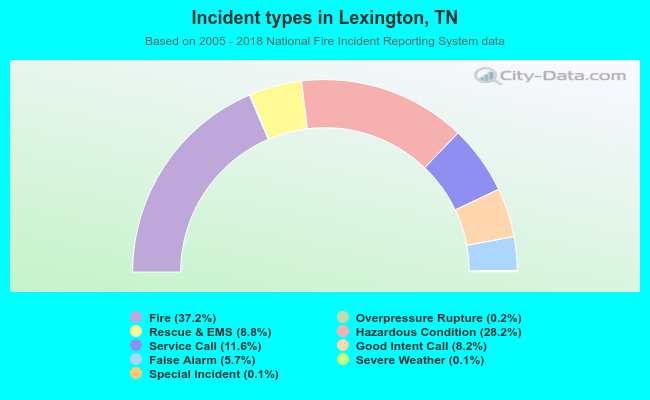 Out of all 3,779 cases reported during the years 2005 - 2018, the most belonged to the categories: Fire (37.2%), Hazardous Condition (28.2%), and Service Call (11.6%).
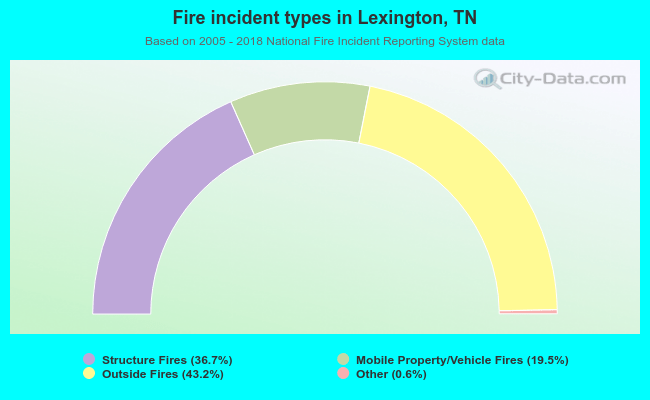 When looking into fire subcategories, the most reports belonged to: Outside Fires (43.2%), and Structure Fires (36.7%).