| Fire incidents reported |
|---|
| Sreet name | Count |
|---|
| BLADES DRIVE | 10 | | HWY D | 10 | | 20 WEEKS | 6 | | COUNTY ROAD 510 | 6 | | ROUTE D | 6 | | 301 W CHARLOTTE | 4 | | 6218 HWY 61 | 4 | | 7 VICTORY ST | 4 | | 723 S. 5TH STREET | 4 | | HWY U | 4 | | HWY U 1 MILE EAST OF LILBOURN | 4 | | WEEKS STREET | 4 | | #1 AMANDA DRIVE | 2 | | #8 VICTORY STREET | 2 | | 100 ROBERTS | 2 | | 1047 RIVER RD. | 2 | | 11 BLADES DRIVE | 2 | | 110 DIGGS | 2 | | 111 BENTON | 2 | | 113 PHILLIPS | 2 | | 119 S 4TH STREET | 2 | | 123 HWY D | 2 | | 129 HWY D | 2 | | 13 VICTORY STREET | 2 | | 132 BAEHR RD. | 2 |
| | | Fire incidents reported |
|---|
| Sreet name | Count |
|---|
| 1327 US HWY 62 | 2 | | 134 JC AVENUE | 2 | | 15 VICTORY STREET | 2 | | 1639 HWY 62 | 2 | | 164 J.C AVE | 2 | | 164 J.C. AVE | 2 | | 169 SOUTH RT. D | 2 | | 169 STATE HWY D | 2 | | 18 VICTORY | 2 | | 18 WEEKS | 2 | | 18 WEEKS STREET | 2 | | 187 HWY 62 | 2 | | 1ST STREET | 2 | | 200 S. HWY D | 2 | | 202 MARKET | 2 | | 203 MOONEY | 2 | | 211 LEWIS | 2 | | 212 BROUGHTON AVE | 2 | | 219 E LEWIS | 2 | | 22 & 20 WEEKS | 2 | | 221 N 1ST STREET | 2 | | 221 SOUTH 5TH STREET | 2 | | 226 BAEHR RD | 2 | | 226 BAEHR ROAD | 2 | | 226 BEAHER RD. | 2 |
|
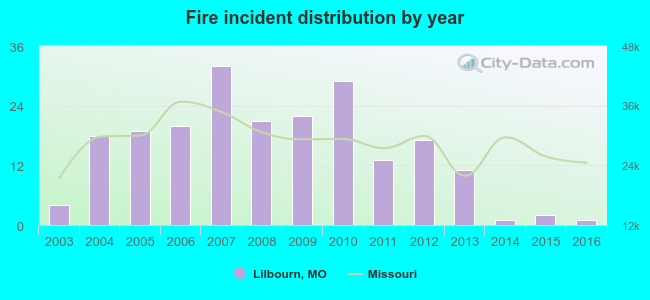 Based on the data from the years 2003 - 2016 the average number of fire incidents per year is 15. The highest number of reported fire incidents - 32 took place in 2007, and the least - 1 in 2014. The data has a decreasing trend.
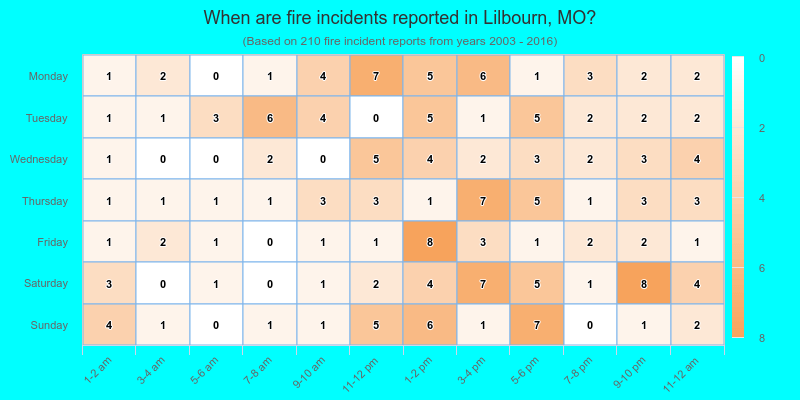
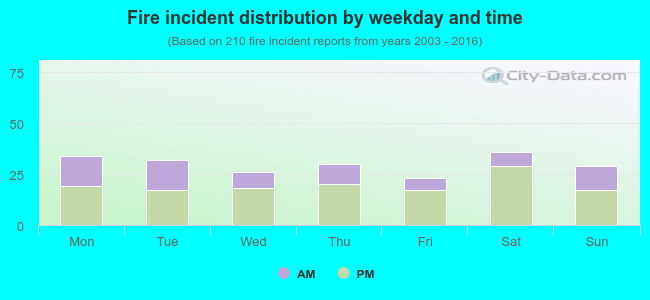 34.8% incidents where reported in the morning and 65.2% in the evening. The most fires (17.1%) took place on Saturday, and the least (11.0%) on Friday.
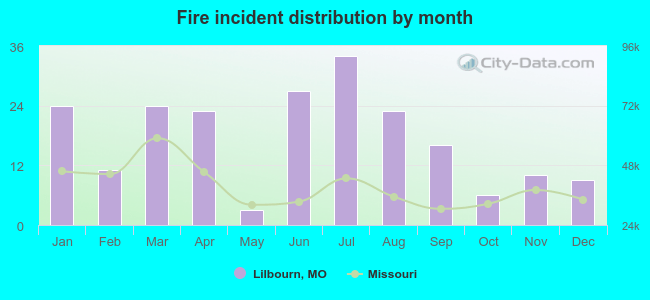 According to the 210 incident reports from years 2003 - 2016 most fires (16.2%) took place during July, and the least (1.4%) in May.
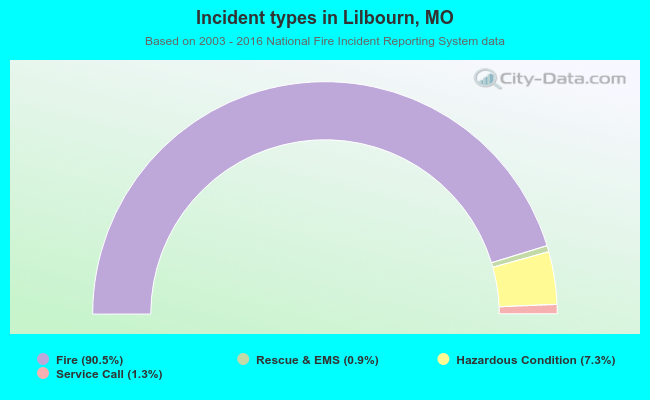 Out of all 232 cases reported during the years 2003 - 2016, the most belonged to the categories: Fire (90.5%), Rescue & EMS (7.3%), and Hazardous Condition (1.3%).
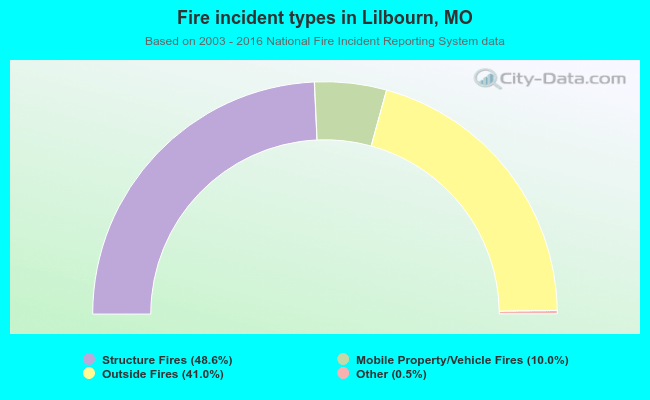 When looking into fire subcategories, the most incidents belonged to: Structure Fires (48.6%), and Outside Fires (41.0%).