Little Chute: Fire Incidents, Wisconsin (WI)
Where are fire incidents reported in Little Chute, WI
Something went wrong! Please refresh the page.
|
| |||||||||||||||||||||||||||||||||||||||||||||||||||||||||||||||||||||||||||||||||||||||||||||||||||||||||||||
2003 - 2018 National Fire Incident Reporting System (NFIRS) incidents
- Incident types reported to NFIRS in Little Chute, WI
- 40346.3%Hazardous Condition
- 16819.3%False Alarm
- 14016.1%Fire
- 647.3%Good Intent Call
- 505.7%Service Call
- 455.2%Rescue & EMS
- 10.1%Special Incident
- Fire incident types reported to NFIRS in Little Chute, WI
- 6143.6%Structure Fires
- 2820.0%Outside Fires
- 2618.6%Other
- 2517.9%Mobile Property/Vehicle Fires
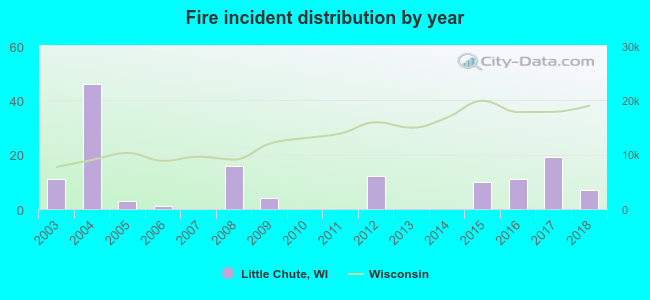 Based on the data from the years 2003 - 2018 the average number of fire incidents per year is 9. The highest number of fires - 46 took place in 2004, and the least - 0 in 2007. The data has a decreasing trend.
The average number of yearly fire incidents per 10k residents in Little Chute, WI compared to nearest cities:
(Note: Based on data for the last 3 years, including only cities with population 5,000 and above)
| Little Chute: | 11.4 |
| Kimberly: | 14.9 |
| Buchanan: | 1.5 |
| Kaukauna: | 24.9 |
| Appleton: | 17.6 |
| Harrison: | 9.8 |
| Freedom: | 10.3 |
| Grand Chute: | 32.3 |
| Menasha: | 31.6 |
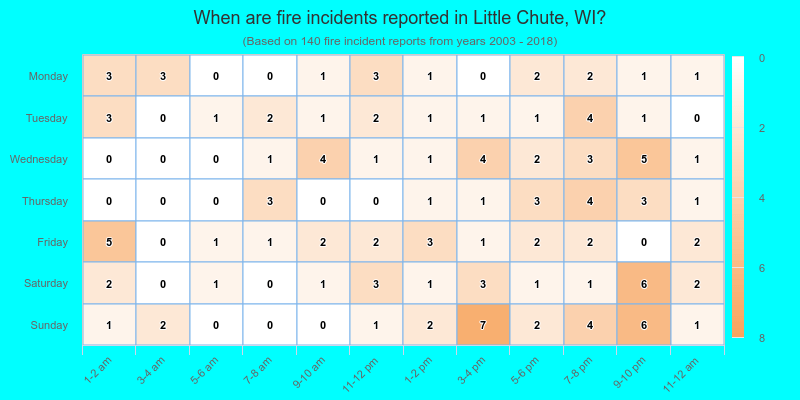
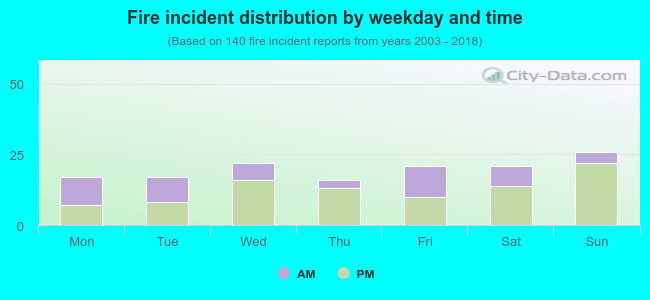 35.7% incidents where reported in the morning and 64.3% in the evening. The most fires (18.6%) took place on Sunday, and the least (11.4%) on Thursday.
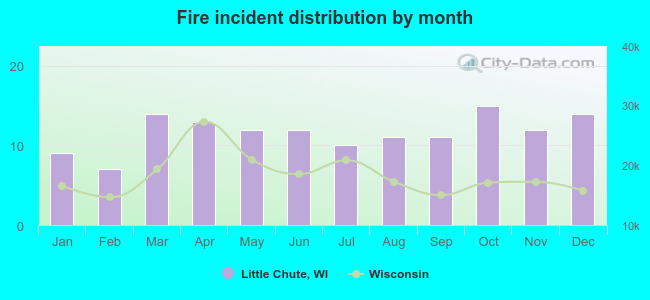 Based on the 140 incident reports from years 2003 - 2018 most fires (10.7%) took place during October, and the least (5.0%) in February.
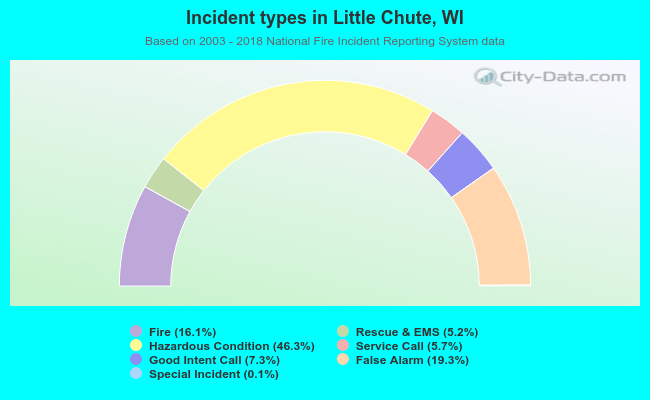 Out of all 871 cases reported during the years 2003 - 2018, the most belonged to the categories: Rescue & EMS (46.3%), Good Intent Call (19.3%), and Fire (16.1%).
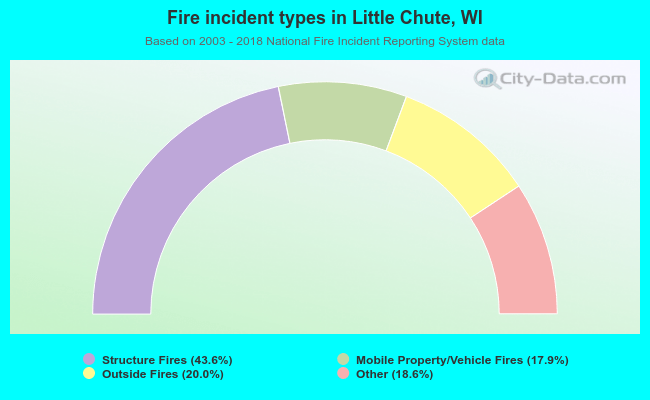 When looking into fire subcategories, the most reports belonged to: Structure Fires (43.6%), and Outside Fires (20.0%).