Livingston: Fire Incidents, California (CA)
Where are fire incidents reported in Livingston, CA
Something went wrong! Please refresh the page.
|
| |||||||||||||||||||||||||||||||||||||||||||||||||||||||||||||||||||||||||||||||||||||||||||||||||||||||||||||
2006 - 2018 National Fire Incident Reporting System (NFIRS) incidents
- Incident types reported to NFIRS in Livingston, CA
- 87454.9%Rescue & EMS
- 32020.1%Fire
- 22814.3%Good Intent Call
- 634.0%False Alarm
- 603.8%Hazardous Condition
- 452.8%Service Call
- Fire incident types reported to NFIRS in Livingston, CA
- 16752.2%Outside Fires
- 8927.8%Mobile Property/Vehicle Fires
- 4714.7%Structure Fires
- 175.3%Other
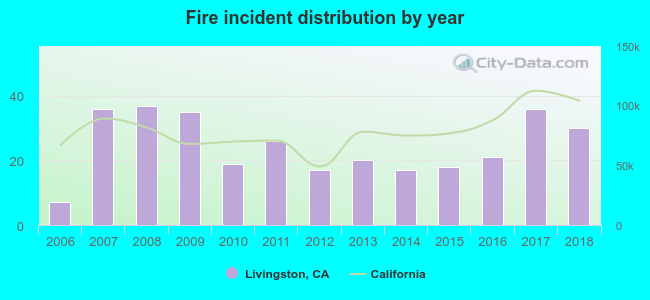 Based on the data from the years 2006 - 2018 the average number of fire incidents per year is 25. The highest number of fire incidents - 37 took place in 2008, and the least - 7 in 2006. The data has a rising trend.
The average number of yearly fire incidents per 10k residents in Livingston, CA compared to nearest cities:
(Note: Based on data for the last 3 years, including only cities with population 5,000 and above)
| Livingston: | 21.0 |
| Delhi: | 81.2 |
| Winton: | 48.1 |
| Atwater: | 23.0 |
| Turlock: | 16.4 |
| Merced: | 60.0 |
| Keyes: | 22.3 |
| Hughson: | 25.4 |
| Newman: | 19.8 |
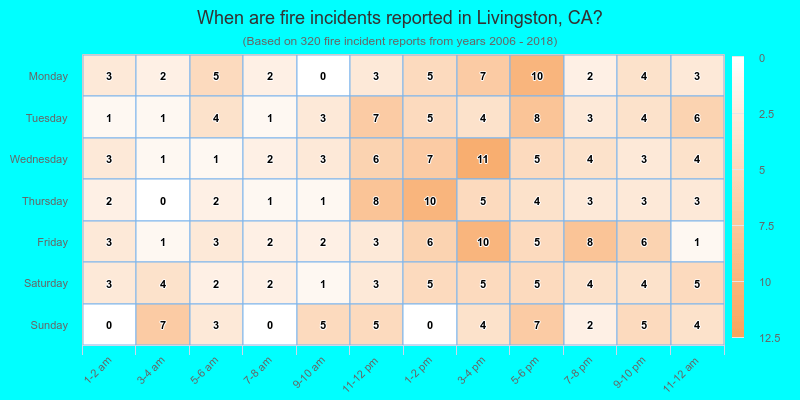
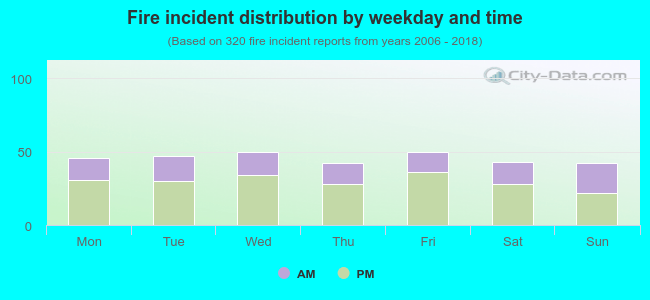 34.7% incidents where reported in the morning and 65.3% in the evening. The most fires (15.6%) took place on Wednesday, and the least (13.1%) on Thursday.
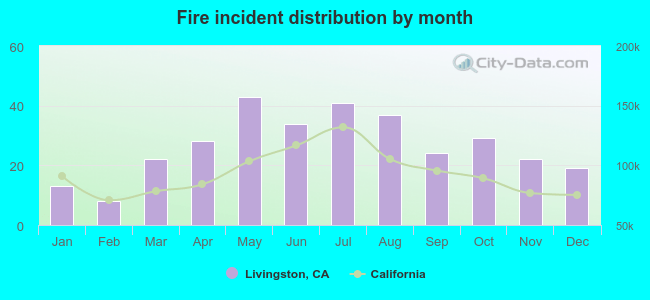 Based on the 320 fire incident reports from years 2006 - 2018 most fires (13.4%) took place during May, and the least (2.5%) in February.
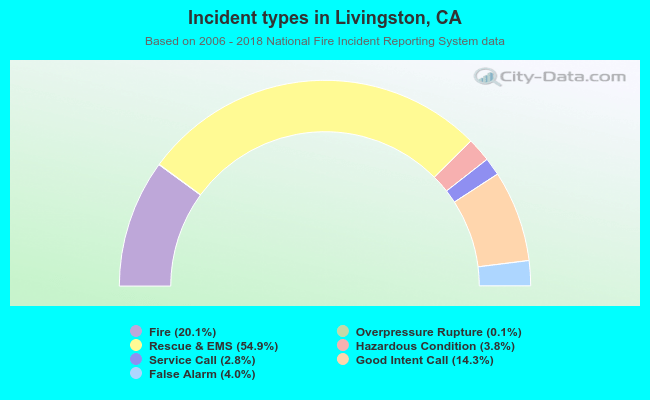 Out of all 1,591 cases reported during the years 2006 - 2018, the most belonged to the categories: Rescue & EMS (54.9%), Fire (20.1%), and Good Intent Call (14.3%).
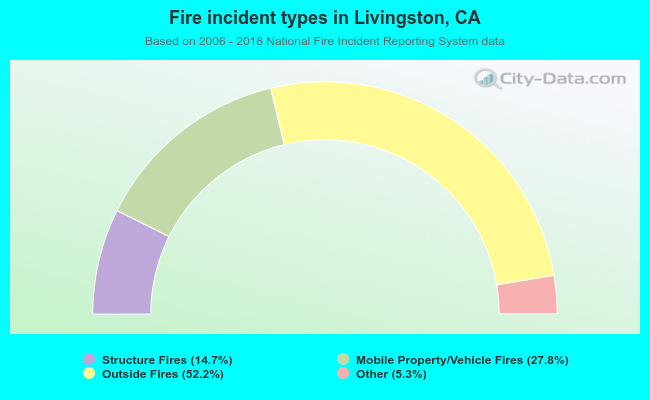 When looking into fire subcategories, the most incidents belonged to: Outside Fires (52.2%), and Mobile Property/Vehicle Fires (27.8%).