Livingston: Fire Incidents, Texas (TX)
Where are fire incidents reported in Livingston, TX
Something went wrong! Please refresh the page.
|
| |||||||||||||||||||||||||||||||||||||||||||||||||||||||||||||||||||||||||||||||||||||||||||||||||||||||||||||
| Other | 1,585 | |||||||||||||||||||||||||||||||||||||||||||||||||||||||||||||||||||||||||||||||||||||||||||||||||||||||||||||
2003 - 2018 National Fire Incident Reporting System (NFIRS) incidents
- Incident types reported to NFIRS in Livingston, TX
- 1,97748.7%Fire
- 80219.8%Rescue & EMS
- 50112.3%False Alarm
- 41010.1%Hazardous Condition
- 2947.2%Service Call
- 501.2%Good Intent Call
- 120.3%Overpressure Rupture
- 110.3%Severe Weather
- Fire incident types reported to NFIRS in Livingston, TX
- 1,17059.2%Outside Fires
- 39520.0%Structure Fires
- 26613.5%Mobile Property/Vehicle Fires
- 1467.4%Other
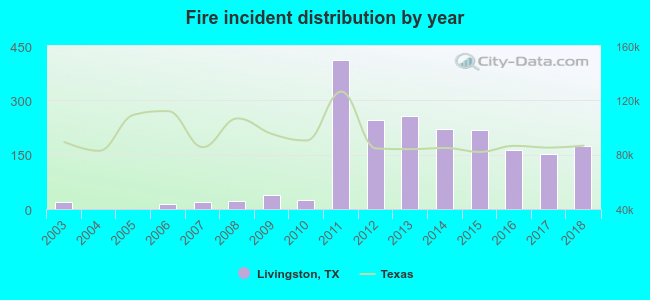 According to the data from the years 2003 - 2018 the average number of fire incidents per year is 124. The highest number of fires - 411 took place in 2011, and the least - 0 in 2004. The data has a growing trend.
The average number of yearly fire incidents per 10k residents in Livingston, TX compared to nearest cities:
(Note: Based on data for the last 3 years, including only cities with population 5,000 and above)
| Livingston: | 316.0 |
| Cleveland: | 466.1 |
| Diboll: | 1.9 |
| Huntsville: | 57.7 |
| Willis: | 247.0 |
| Conroe: | 106.3 |
| Spurger: | 23.3 |
| Lufkin: | 50.6 |
| Dayton: | 77.7 |
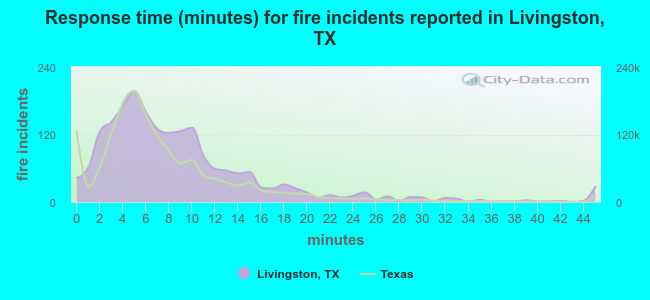 The median response time based on all reported fire incidents is 7 minutes. This is similar to the Texas median value.
The median response time in Livingston, TX compared to nearest cities:
(Note: Based on data for all years, including only cities with at least 500 fire incidents)
| Livingston: | 7 minutes |
| Coldspring: | 12 minutes |
| Shepherd: | 10 minutes |
| Point Blank: | 14 minutes |
| Cleveland: | 10 minutes |
| Woodville: | 9 minutes |
| Trinity: | 8 minutes |
| New Waverly: | 9 minutes |
| Huntsville: | 10 minutes |
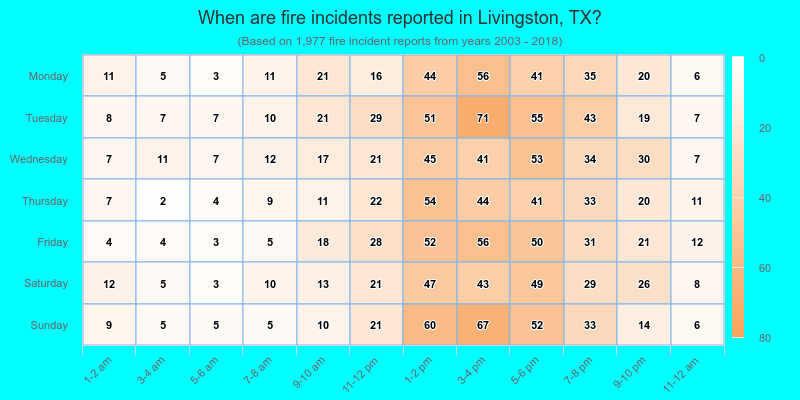
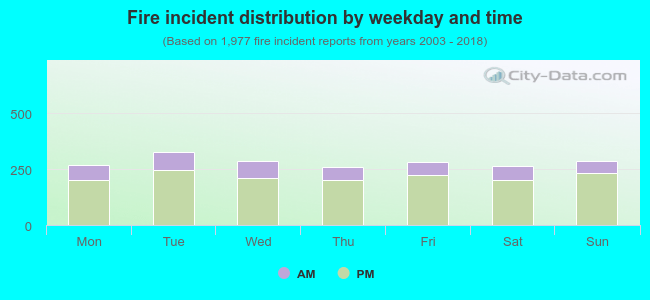 23.3% incidents where reported in the morning and 76.7% in the evening. The most fires (16.6%) took place on Tuesday, and the least (13.1%) on Thursday.
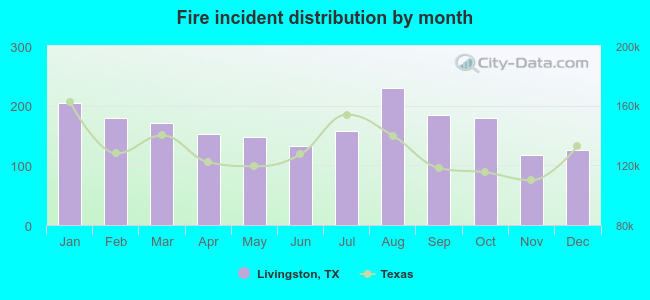 According to the 1,977 fire incidents from years 2003 - 2018 most fires (11.6%) took place during August, and the least (5.9%) in November.
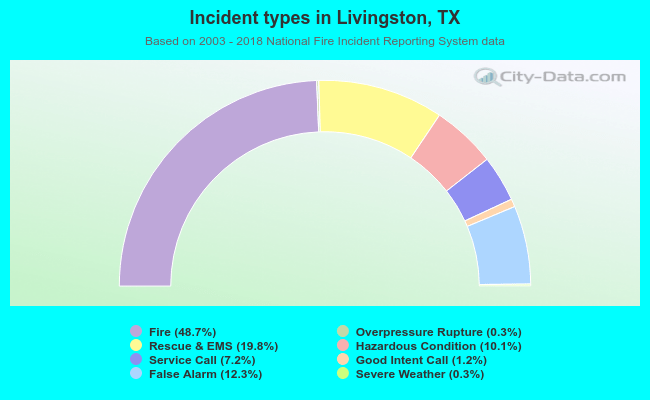 Out of all 4,057 cases reported during the years 2003 - 2018, the most belonged to the categories: Fire (48.7%), Rescue & EMS (19.8%), and False Alarm (12.3%).
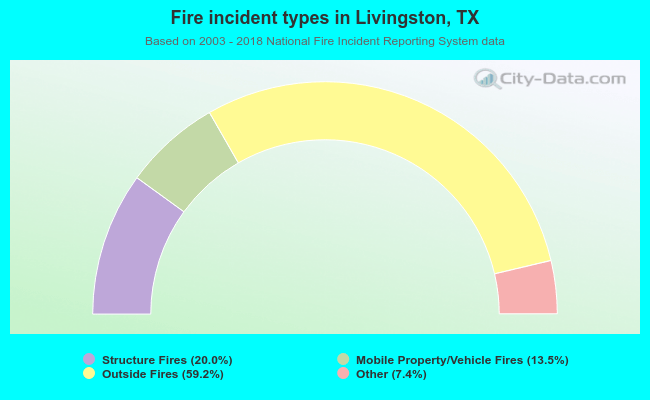 When looking into fire subcategories, the most incidents belonged to: Outside Fires (59.2%), and Structure Fires (20.0%).