| Fire incidents reported |
|---|
| Sreet name | Count |
|---|
| JOLON RD | 40 | | SHAKE RIDGE RD | 28 | | BRYSON HESPERIA RD | 12 | | INTERLAKE RD | 12 | | NEW PLEYTO RD | 12 | | LOCKWOOD JOLON RD | 10 | | LOCKWOOD SAN LUCAS RD | 10 | | BRADLEY LOCKWOOD RD | 8 | | ARGYLE RD | 6 | | FIDDLETOWN RD | 6 | | HALE RD | 6 | | MARTINEZ RD | 6 | | ALLAN RD | 4 | | CENTURY LN | 4 | | CHADWICK DR | 4 | | COPPERHEAD RD | 4 | | DAVIS CANYON RD | 4 | | INTERLAKE | 4 | | JOLON | 4 | | LOCKWOOD-SAN LUCAS RD | 4 | | NEW PLETO ROAD | 4 | | NEW PLEYTO | 4 | | SAN ANTONIO LAKE | 4 | | SONSHINE LN | 4 | | 5800 FRUDDEN | 2 |
| | | Fire incidents reported |
|---|
| Sreet name | Count |
|---|
| 65340 LOCKWOOD-SAN LUCAS ROAD RD | 2 | | ASHLAND DR | 2 | | BRADLEY-LOCKWOOD RD | 2 | | BRADLEY-LOCKWOOD RD RD | 2 | | BRYSON RD | 2 | | BUCKBOARD DR | 2 | | CAD CLARA RD | 2 | | CHADWICK | 2 | | CHALK FIRE LOS PADRE | 2 | | CHAPARRAL DR | 2 | | CHARLESTON RD | 2 | | COPPERHEAD RD. RD | 2 | | CROSS RD / LOCKWOOD JOLON RD RD | 2 | | DEL VENTURI | 2 | | E LOOP | 2 | | FERN RIDGE RD | 2 | | FIDDLETOWN RD | 2 | | FORT HUNTER LEGGITT RD | 2 | | FRUDDEN RD | 2 | | INSPIRATION DR | 2 | | INTER LAKE RD. & BRYSON HISTER | 2 | | JOLON RD | 2 | | JOLON ROAD | 2 | | JOLON ROAD RD | 2 | | |
|
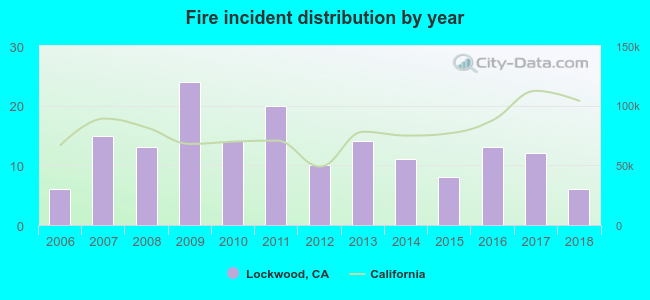 According to the data from the years 2006 - 2018 the average number of fires per year is 13. The highest number of fires - 24 took place in 2009, and the least - 6 in 2006. The data has a constant trend.
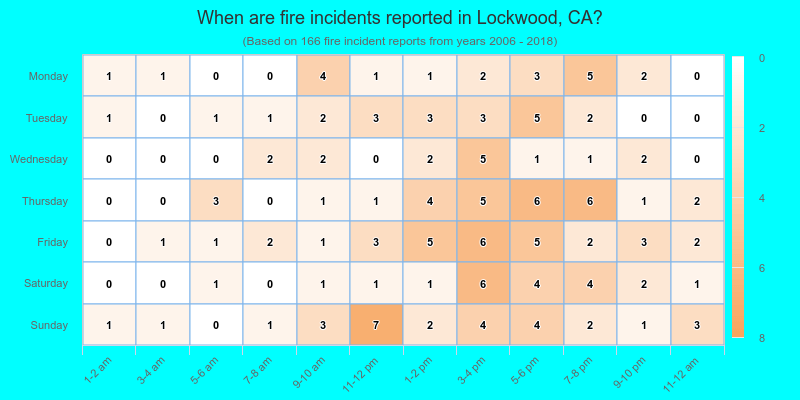
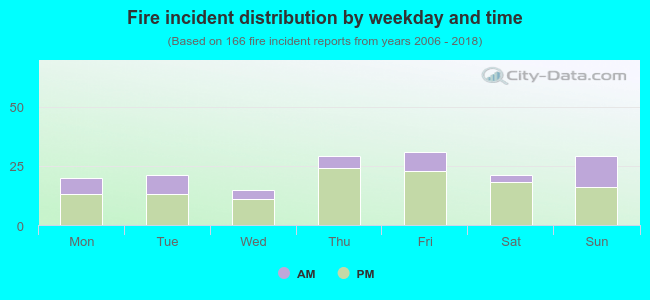 28.9% incidents where reported in the morning and 71.1% in the evening. The most fires (18.7%) took place on Friday, and the least (9.0%) on Wednesday.
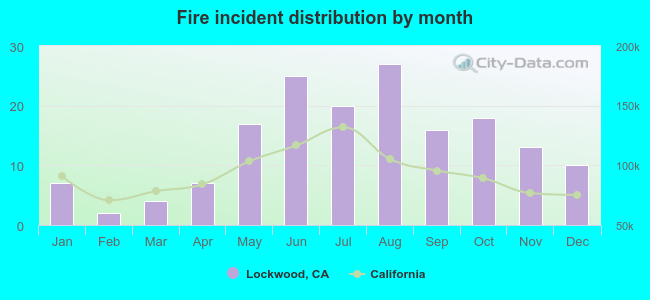 Based on the 166 incident reports from years 2006 - 2018 most fires (16.3%) took place during August, and the least (1.2%) in February.
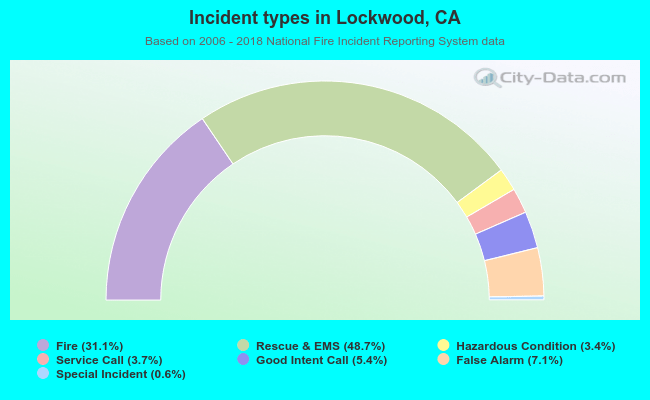 Out of all 534 cases reported during the years 2006 - 2018, the most belonged to the categories: Overpressure Rupture (48.7%), Fire (31.1%), and Good Intent Call (7.1%).
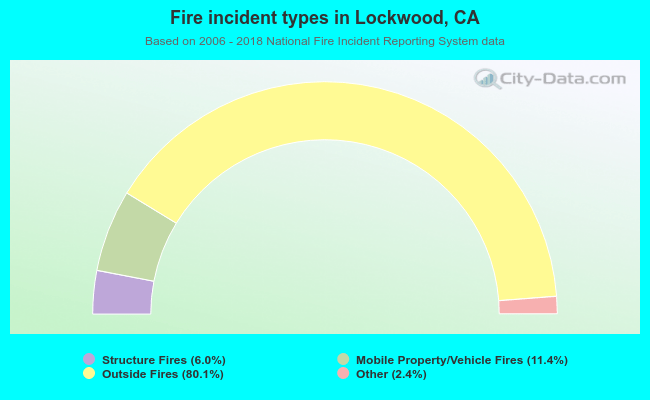 When looking into fire subcategories, the most incidents belonged to: Outside Fires (80.1%), and Mobile Property/Vehicle Fires (11.4%).